data

What Happens After You Win an Oscar? /  by Usamah Khan

Supposedly Richard Feynman once said “the Nobel Prize will be the tombstone on all great work”. Ironically he went on to win the prize for groundbreaking work, but at the core he raised a valid question which I think is ‘what happens when after years of passionate work and putting in your all, you finally receive recognition at the highest level’?

Most disciplines have an award at the top. One that’s highly coveted, more prestigious than all the others and reserved for experts, the best of the best - The Nobel Prize, Fields Medal, Pulitzer Prize and so on. Becoming an expert requires a commitment of mind, body and time while navigating the many inevitable obstacles that get in the way of achieving success. More often than not it’s only those with passion and a fire inside who can surmount the largest of obstacles to produce truly groundbreaking work. But what happens when people achieve success and recognition for their work? Rarely do those who practice in a field and win an award do so more than once.

Is this because people genuinely only have enough in them to produce one piece of groundbreaking work in their lifetime? Or is it because that once they receive this recognition, they no longer have the drive or passion to produce and overcome obstacles like they used to?

This last question got me thinking about how I could find a data-driven answer. But when talking about passion and creativity, we’re talking about variables that on their own don’t have any direct measures aside from rewards. There’s no ‘passion scale’ or ‘creativity spectrum’, just acknowledgment when work is extraordinary. So then how can we measure passion before and after recognition? This got me to thinking about cinema and a certain actor.

The McConnaissance
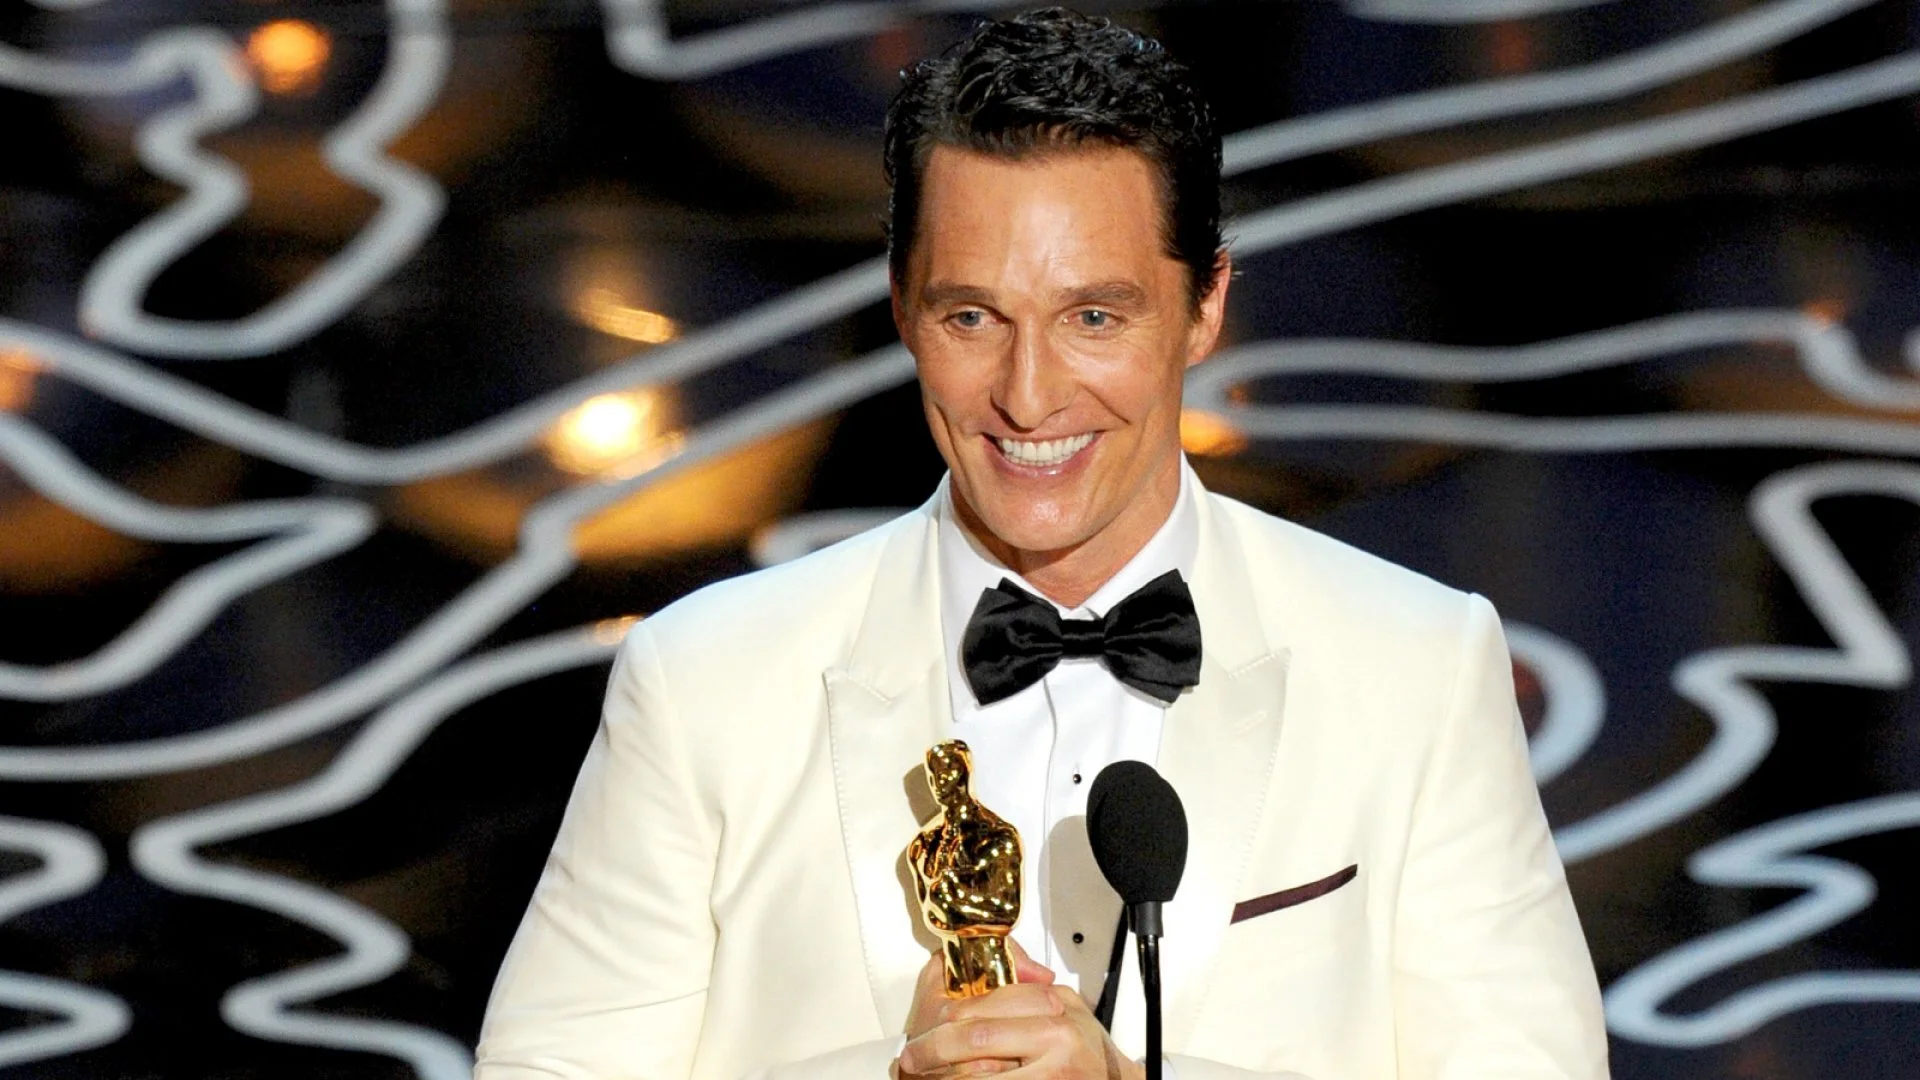
The smile of an Oscar winner

The smile of an Oscar winner

Remember Matthew McConaughey? Between 2011 and 2014 he was experiencing a revival of his career, taking on more nuanced and cerebral roles than the usual handsome, romantic heartthrob characters he was known for. He performed in a slew of critically acclaimed and high grossing films such as “Mud”, “The Lincoln Lawyer”, “Bernie”, “Interstellar”, and a stint on television in one of my favourite shows - “True Detective”. Many critics referred this time as the “McConaissance”. He truly worked on revitalizing his career and this time eventually culminated in him receiving an Academy Award for Best Actor for his portrayal of Ron Woodroof in “Dallas Buyers Club”. 

Matthew McConaughey as Rust Cohle in True Detective

Matthew McConaughey as Rust Cohle in True Detective

However, since then, his career has been quiet with only a handful of lackluster appearances in films such as “The Dark Tower”, “Beach bum” “The Gentleman”. In almost the same amount of time that the “McConaissance” was declared, it ended. So to our question, did Matthew McConaughey lose whatever it was that drove him to portray roles to critical acclaim? Is this a correct observation to make? And is this a common occurrence among other actors after they achieve the highest award in acting?

The Academy Award for Best Actor

Let’s first look at how we can come up with a measure for creativity and passion. The Academy Award, more commonly known as the Oscar, for Best Actor/Actress, is given out once a year and is probably the most highly coveted award in the field of cinema. It is given “in honor of an actor who has delivered an outstanding performance in a leading role while working within the film industry”. Only a handful of artists have won the award more than once. In fact in its 92 years of running, 83 men have won “Best Actor”, and 76 women have taken home the title of “Best Actress”. 

In addition to this, an outstanding performance is more often than not in a critically acclaimed film. In fact the average ratings for films in which there was a winner for best actor/actress on review aggregator Rotten Tomatoes is 88% / 86% respectively.
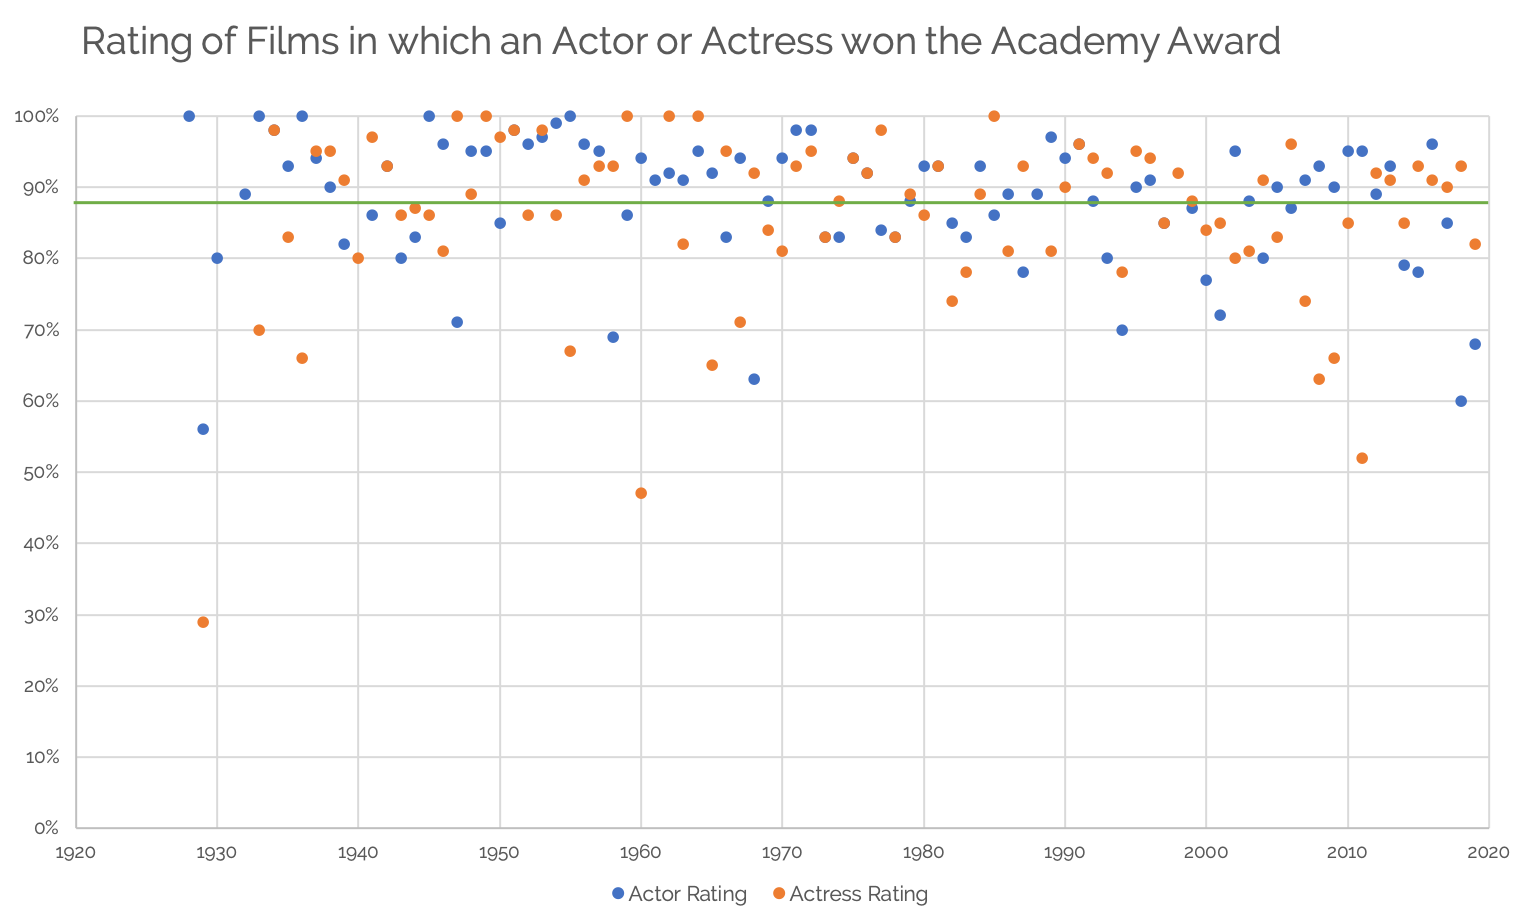
Figure 1 - Chart showing the rating of films in which the lead actor or actress won an Academy Award for their performance. Compiled from scraping Rotten Tomatoes for ratings and Wikipedia for academy award winners.

Figure 1 - Chart showing the rating of films in which the lead actor or actress won an Academy Award for their performance. Compiled from scraping Rotten Tomatoes for ratings and Wikipedia for academy award winners.

With that, maybe we can look at the ‘quality’ of films via proxy variable - in this case, ratings - before and after an actor or actress won the Academy Award, as a measure of the quality of their career. We can use the scores from Rotten Tomatoes - a site that may be familiar to you, but briefly - they are an aggregator that take all reviews in all forms and scales and simply take whether or not the review was positive or “fresh” (thumbs up, above 60% or 3 stars) and give a score that “represents the percentage of professional critic reviews that are positive for a given film”. I added a section in the methodology if you’re keen on understanding further.

Measuring The McConnaisance

We started our discussion looking at Matthew McConaughey so now let’s look back at the question in his context. The figure below shows his career from 1990 to 2020 and the ratings the films he acted in received. In the late 90s he seemed to be performing in some highly rated films. Yet something changed between 2000 and 2010 where the opposite was true. 
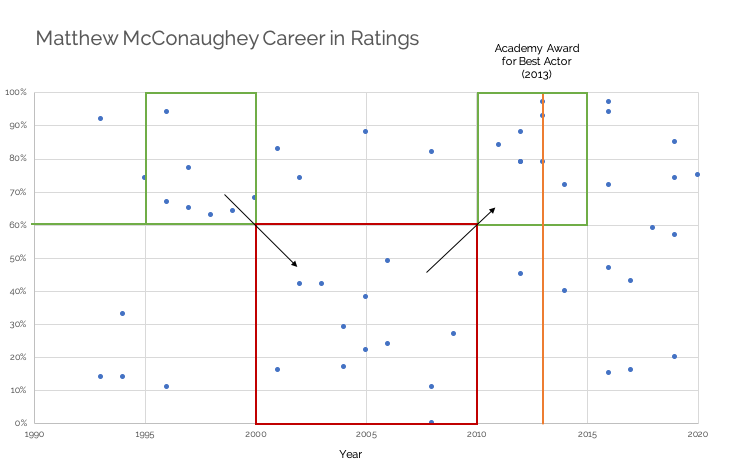
Figure 2 - Chart showing ratings over the course of Matthew McConaughey’s Career

Figure 2 - Chart showing ratings over the course of Matthew McConaughey’s Career

During “The McConnaisance”, between 2010 and 2015, he was experiencing a definite height of his career that seemed to culminate in his 2013 Oscar. But what’s interesting to note is between 2015 and 2020 McConaughey acted in a greater number of films than any 5 year period before. In addition, there seems to be a larger spread in the quality of these films.

Is the variance in this quality a result of his acting? Perhaps his critical accomplishments net him enough demand that he could afford to act in films that may offer a higher return in box office success, but not in ‘quality’ of role. Regardless he’s kept busy so his drive to continue acting has not wavered.

Whatever the answer, there was a definite change in his behaviour over the 6 years after his Oscar win from the 6 years prior to it. We can explore this further by looking at the average ratings of the films he was in over this 12 year period and also extract his highest rated film of each year. 
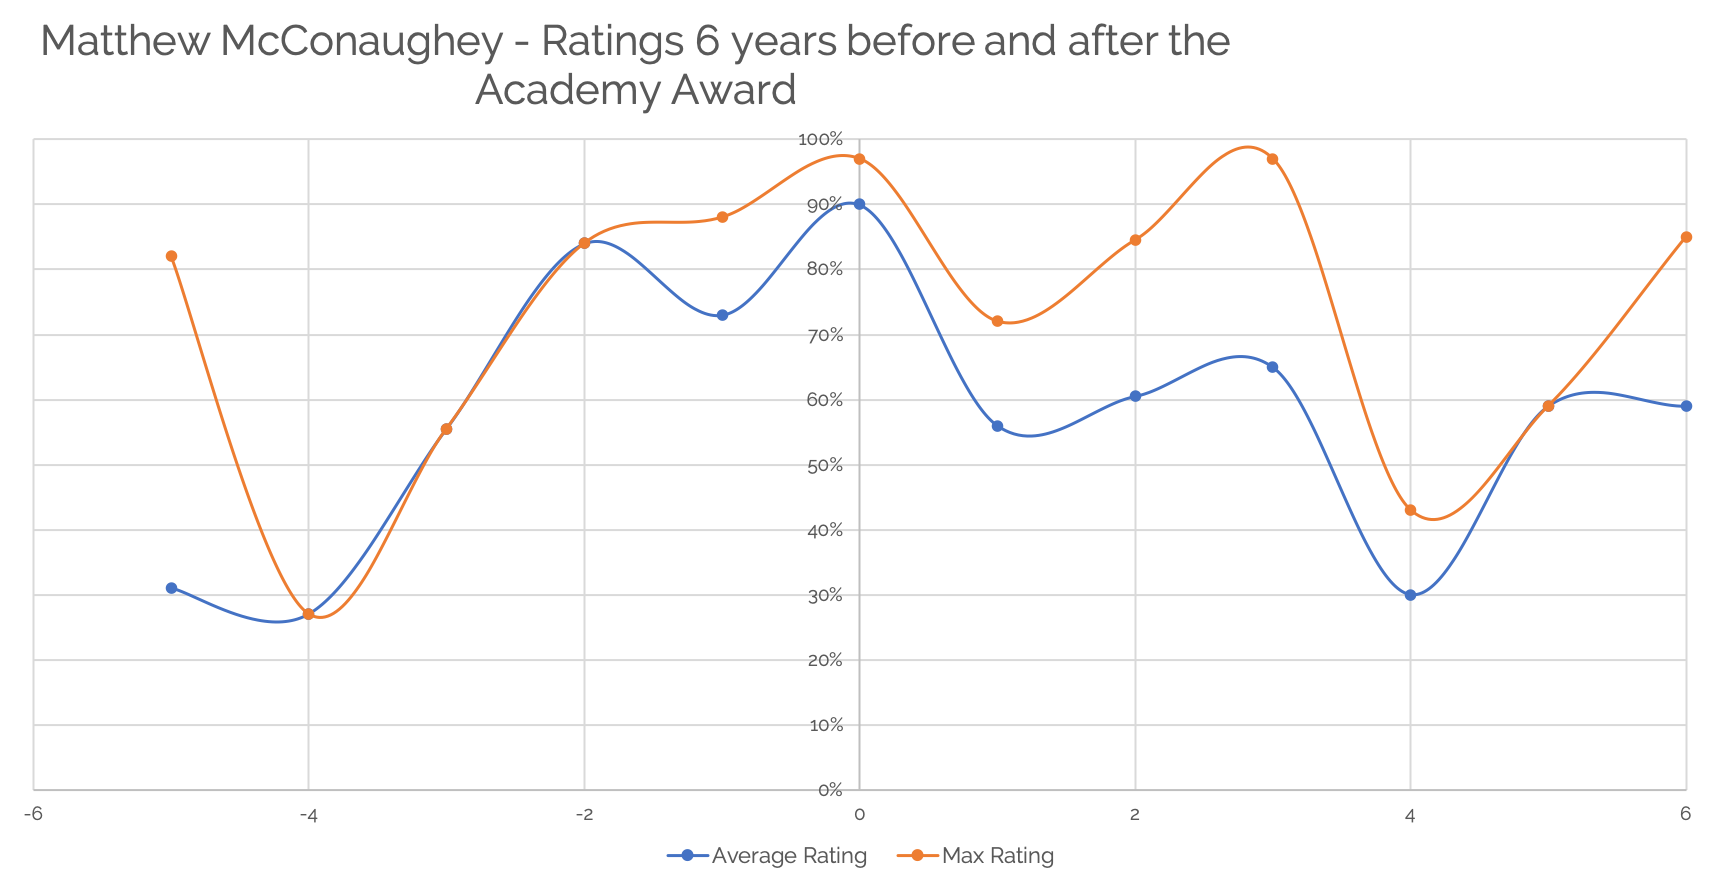
Figure 3 - Chart showing ratings over 6 years before and after winning the Academy Award for best Actor

Figure 3 - Chart showing ratings over 6 years before and after winning the Academy Award for best Actor

Taking time = 0 as the year he won the Academy Award, it’s evident that there was a gradual incline in the quality of the films he performed in. In fact, the average ratings largely seem to follow the same trends from about 4 years until his award. At this point however, there started to show a difference between the two metrics. We can gather from this that while Matthew McConaughey’s career since has included some very well received films, there've been quite a few movies of a lesser quality bringing down his yearly average rating.

Is this a common occurrence?

So in the case of Matthew McConaughey, we have two sets of information indicating some sort of behaviour change. But what about other actors? Did their pre/post success follow the same pattern? We can compare them along the same lines as we did with McConaughey, standardizing the year they won the academy award as year 0 and looking at 6 years before and after. 

Between the years of 2000 and 2014 there were only a few actors who won the academy award who had careers prolific enough to have data for 6 years before and after. We’re going to take a closer look at 4 of them alongside Matthew McConaughey.

At first glance there doesn’t seem to be as visible a pattern before and after. However, looking closer, it becomes interesting to note that at time = 0 (the year of winning the award) actors in general are experiencing a peak in their careers, and more interestingly, in general seem to be observing a short term decline in their ‘best performance’ of the year. Looking at the longer term trends they somewhat stabilize but what’s fascinating is what seems like a ‘hangover’ to their win.
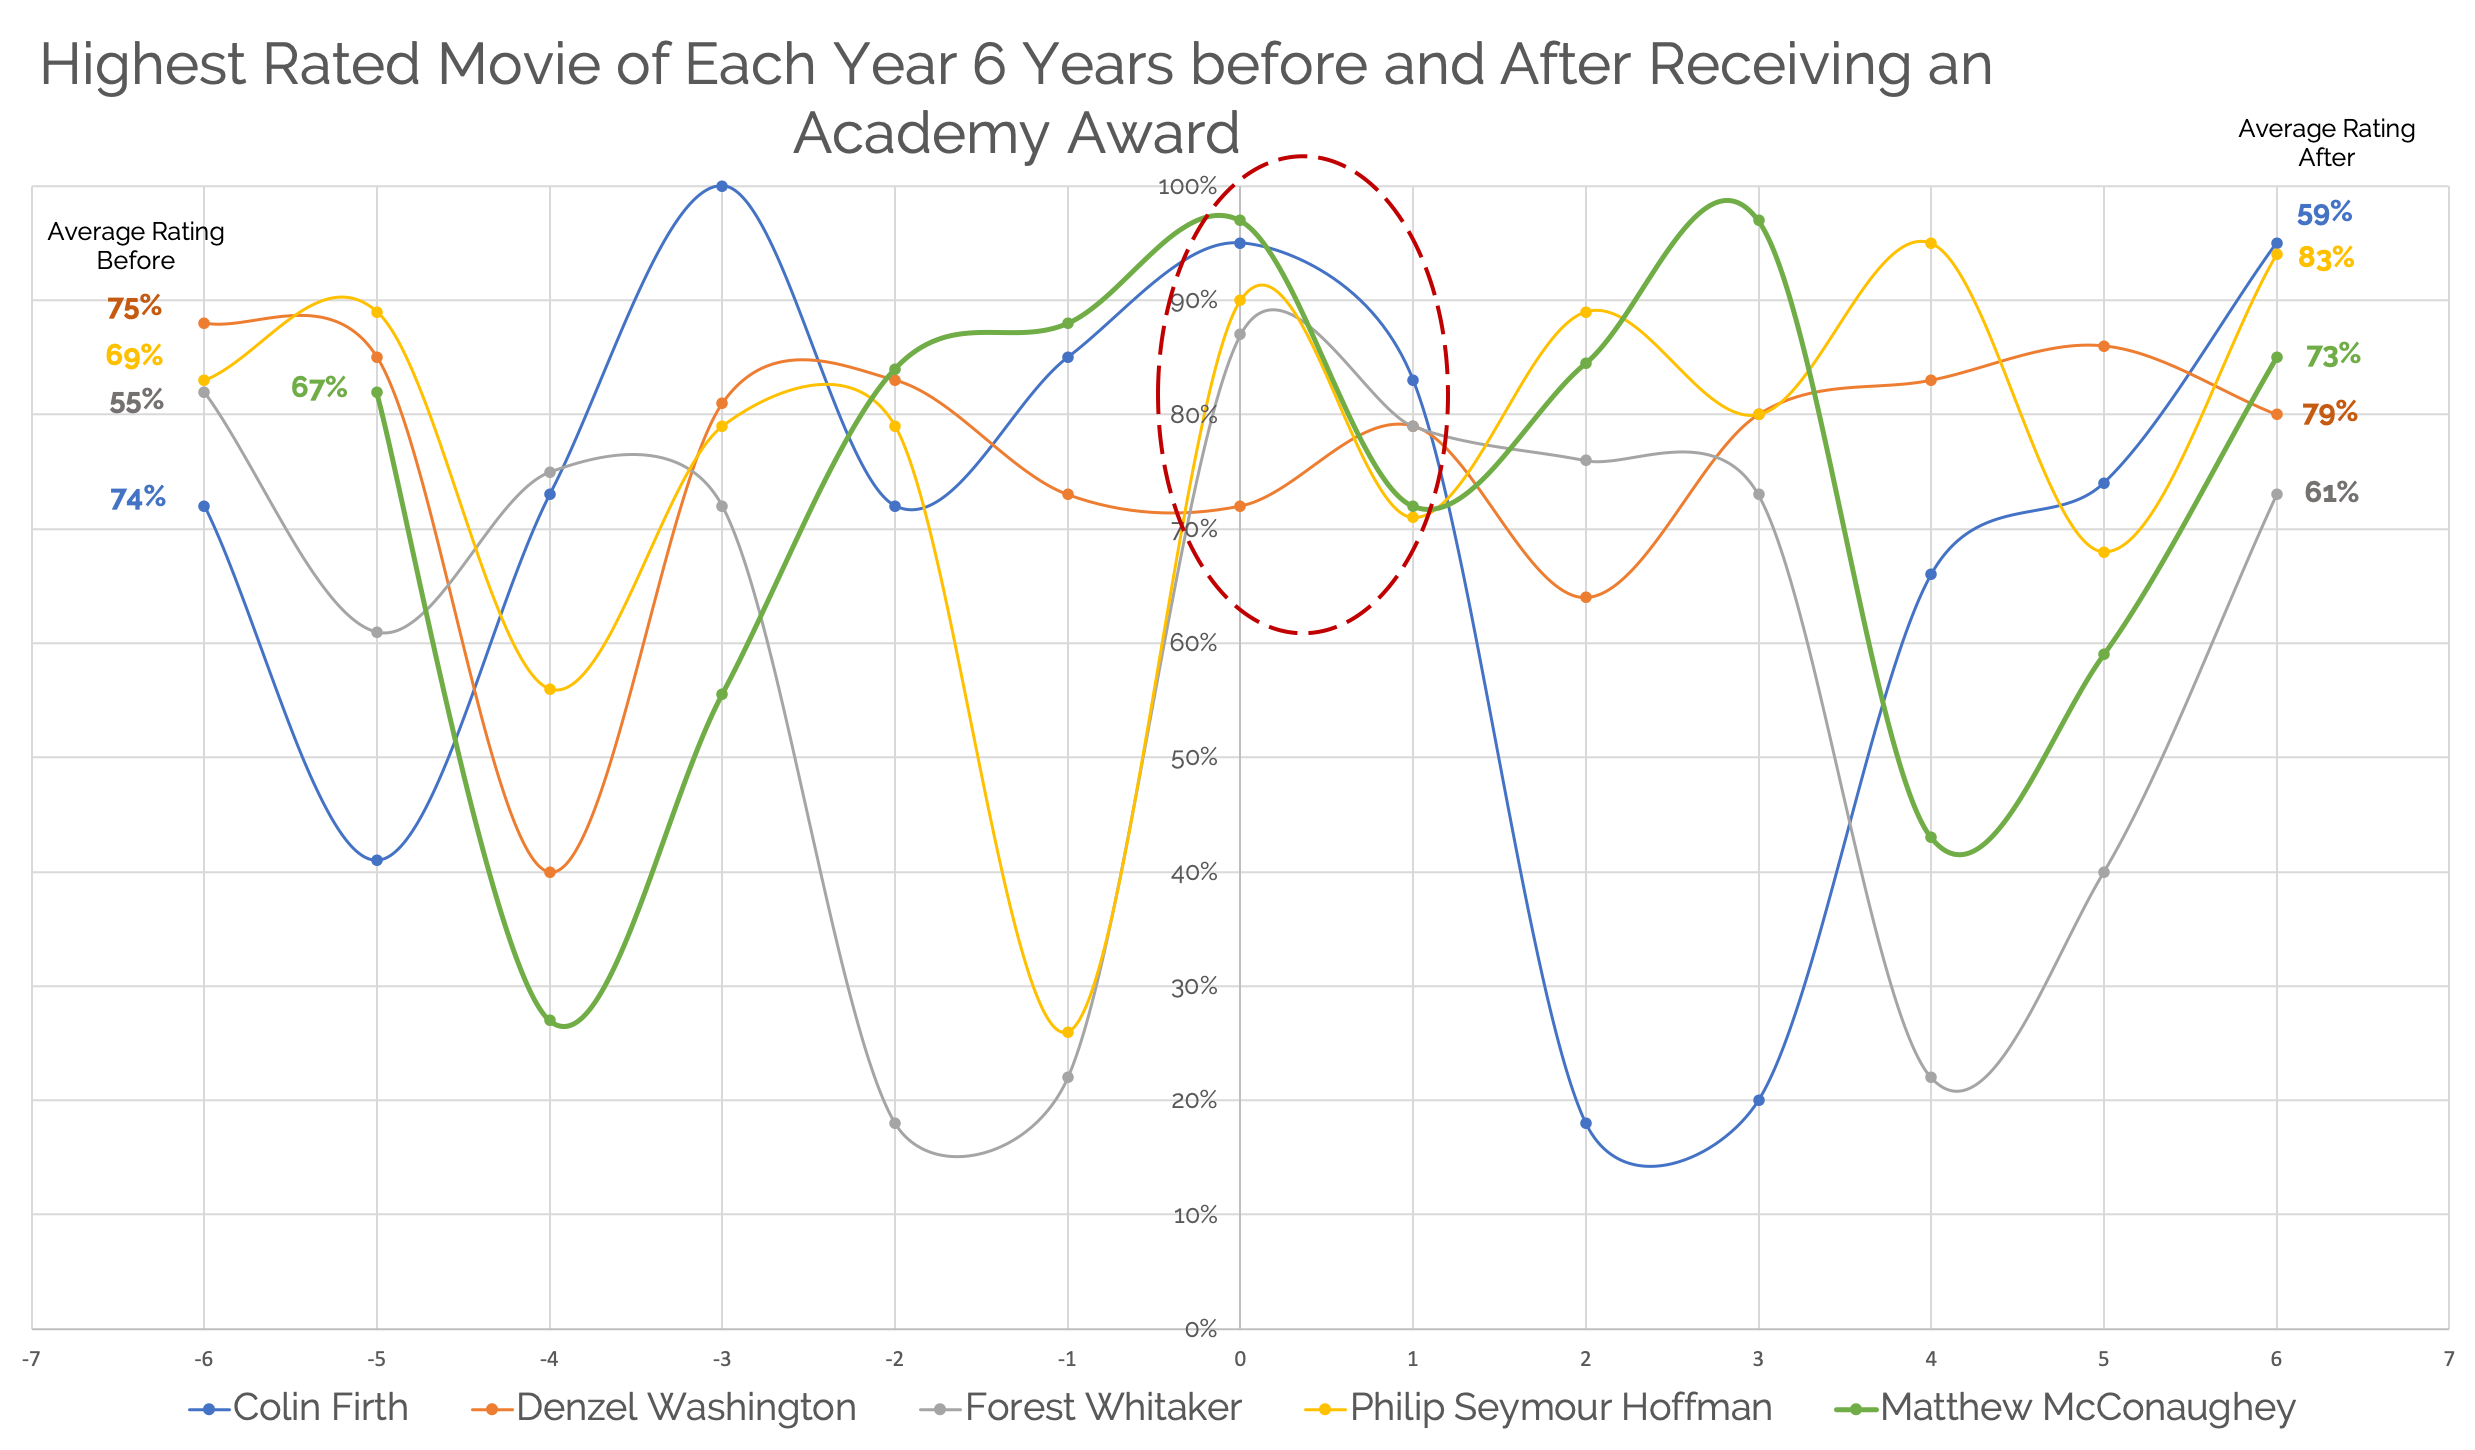
Figure 4 - Chart showing ratings over 6 years before and after winning the Academy Award for best Actor for a sample set of actors

Figure 4 - Chart showing ratings over 6 years before and after winning the Academy Award for best Actor for a sample set of actors

Can we now say with any certainty that an Academy Award win leads to a dip in performance? It certainly seems that something happens, with some actors being able to bounce back quicker than others. Taking a sample set from best actress winners in the same vein as actors, we can see a similar pattern with a decline in performance in the short term.
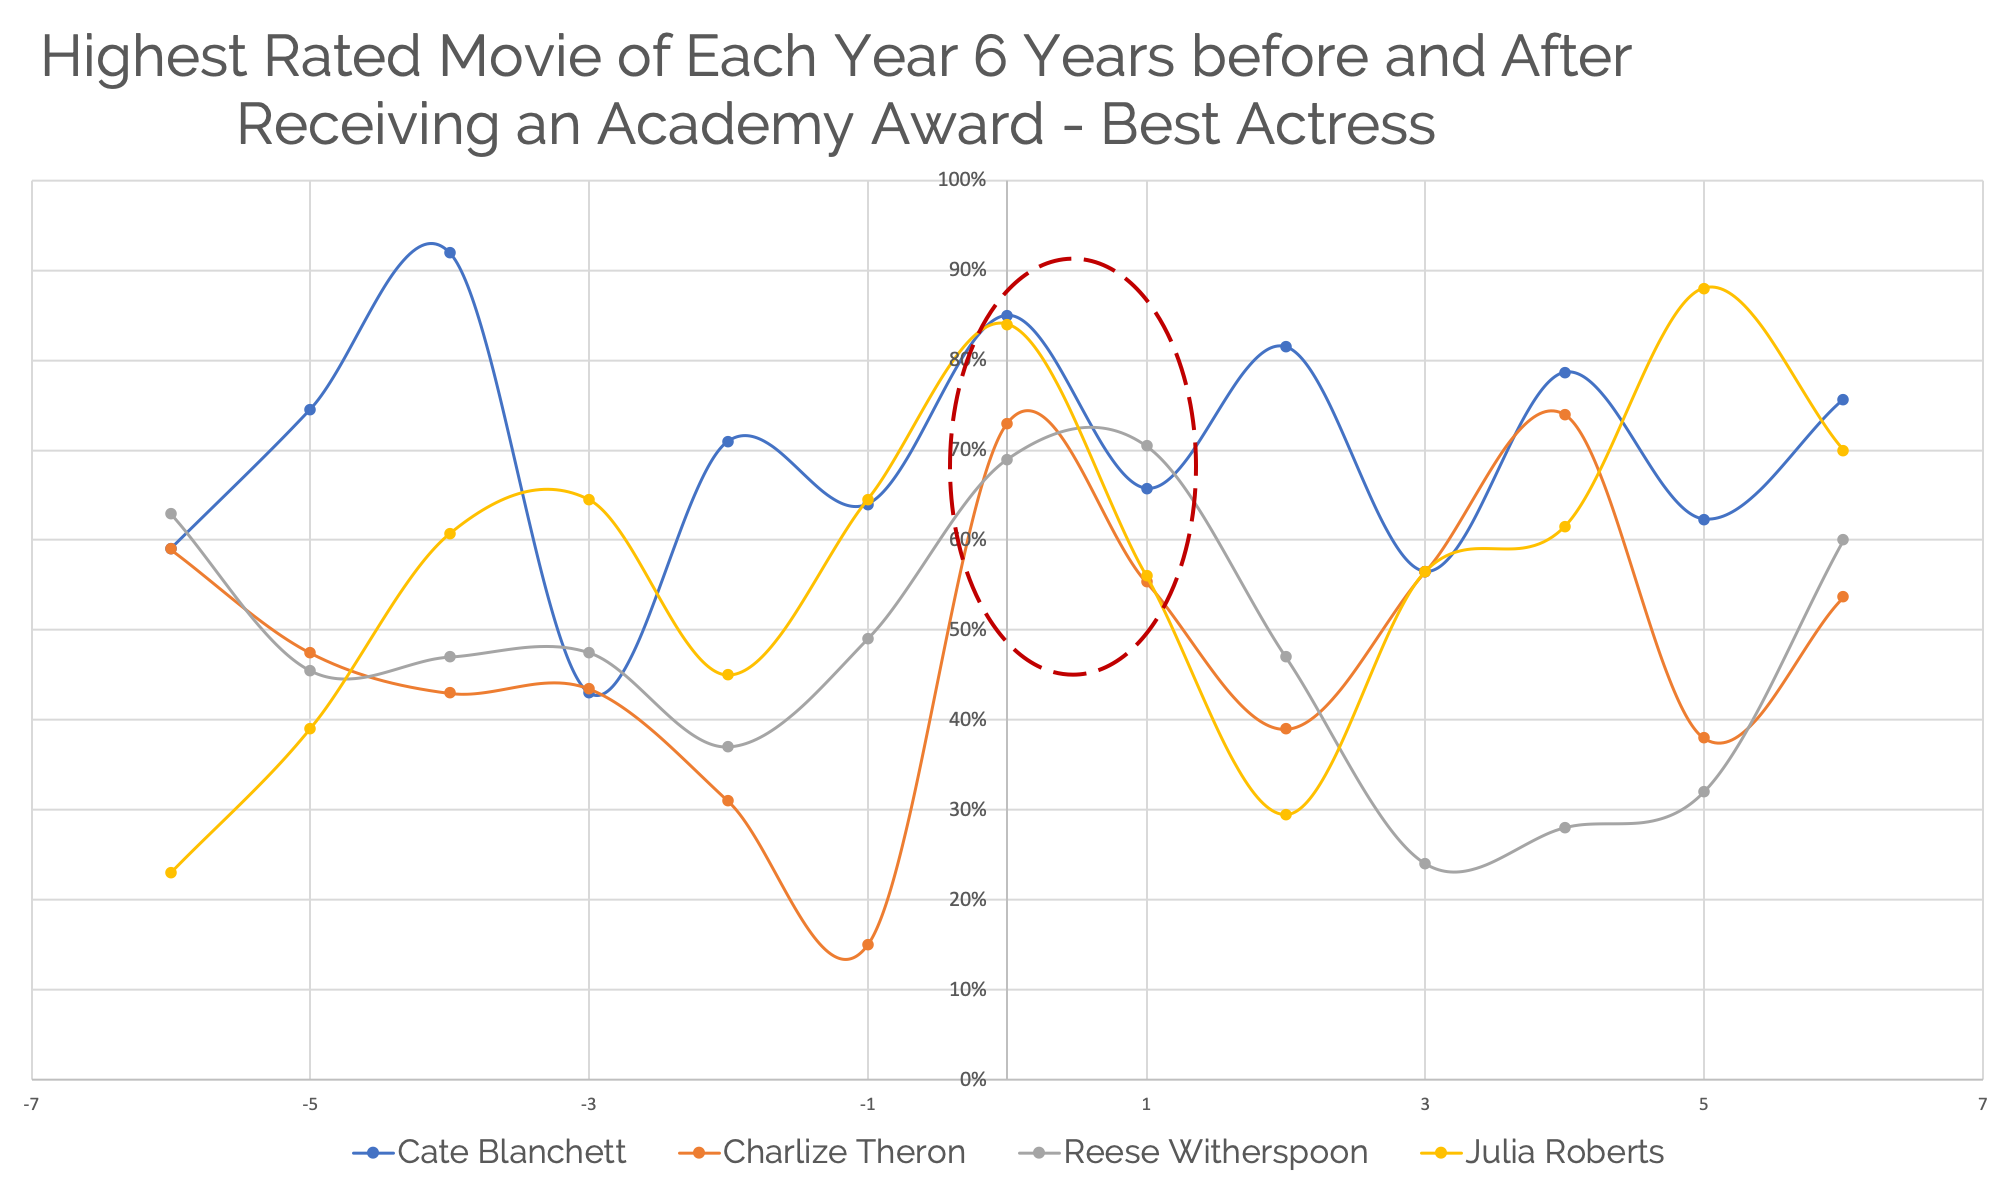
Figure 5 - Chart showing ratings over 6 years before and after winning the Academy Award for best Actress

Figure 5 - Chart showing ratings over 6 years before and after winning the Academy Award for best Actress

Where do we take this?

The study illuminated some insightful patterns among academy award winners. But what do we take from this? Do we stop giving out awards to encourage creative work? That seems a little far fetched, especially considering that perhaps it’s in pursuit of this recognition that creatives find their drive. I find this is reflected more and more in today's society. We concern ourselves so much with likes, views, comments and followers that a lot of drive to create content is fuelled by these metrics. 

This ultimately raises an observation that in acting, there is no objective indicator of performance - or at least not one that I’m aware of. The difficulty lies in determining a quantitative measure that does not currently exist. With that in mind, it would be worthwhile to develop a more complete measure of an actor’s performance within a given year. Maybe this framework or model could include additional measures such as the actor’s time on-screen, the number of roles they acted in within a given year,  the box-office earnings from their movies, the pay they received, along with the overall critic rating for the film itself. This metric could perhaps then be extrapolated as an actor’s score - deepening and complexifying the rating system that we are taking from Rotten Tomatoes, to better quantify creativity. Perhaps we can even offer a data-driven approach to acting that artists, dancers and even amateur actors on Social Media platforms such as Instagram and TikTok have been following for years.

We can also look at other fields. For example, athletes don’t seem to follow the same success patterns as actors or Nobel Prize winners. Fairly often, star athletes tend to reign over many years and amalgamate multiple wins while at the top of their game across all forms of sports. 

Micheal Jordan played 15 NBA seasons, out of which he won 6 NBA championships with the Chicago Bulls and to this day Jordan is the all-time 2nd highest scorer of the NBA. Jordan’s reign and success, however, was objectively measured and easily quantifiable. One could argue that his achievement of the highest levels of recognition in the sport, was a direct outcome of effort and quality of his work. This correlation between quality of work and recognition seems much more linear than the Academy Awards rubric for “winning” the Oscar which is neither objective nor static over time. And this is basketball, where it could be argued that the highest level of success in the sport - winning an NBA championship, could still be attributed to the larger team, rather than simply one individual.  

When we turn to look at other more individualistic sports than basketball such as Olympic sprinting or Tennis, there emerges perhaps an even stronger correlation between quality of work and recognition/success.

Ultimately, actors provide us a great source of entertainment. One could argue that during this time, locked indoors and unable to go outside, we’ve turned to them. They help get us through the evenings and keep us company giving us an outlet to feel our emotions or escape from them. So they should be rewarded. But the more so applauded for work they create in such a risky field with no guarantees and no safety nets. Maybe we can learn to do this as well. With that, I’ll end with a thought from the great Rodney Mullen.

“Just find joy in what you do for the sake of it. And then recognize how you're being shaped in the process, and hopefully, over time, you become a better person through it.” 

Methodology

There were a couple of ways I went about structuring my thoughts and gathering the data. Below I go over some of my thought process and what I did, but feel free to reach out if you have any questions!

Exploring the Questions

The first step I needed to take was to identify a measure for ‘quality’. Cinema is a subjective field. A film may be lauded by some but criticized by others, and outside of awards, there aren’t really any metrics to measure individual performance as such.

However, there are metrics that one can attach to the quality of a film, such as ratings and box office performance. But these metrics are difficult to standardize. Take in the case of movie critic reviews. All over the world, critics and journalists (professional or amateur) go to screenings, absorb the film and share their thoughts sometimes attaching a score that could be anything from a 1-10 scale, 5 star rating or simply give a thumbs up/thumbs down. Furthermore between all of these systems, it’s difficult to make sense of the subjective nature of scoring. Legendary film critic Roger Ebert once reflected on how his style of rating movies changed over time according to what his readership was looking for. He found they weren’t looking for a ‘review’ of the film, but simply advice on whether or not they should spend their evening watching the film in question.

There are a few ways to solve this problem, but as I briefly touched on, review aggregator Rotten Tomatoes seems to have done it best. Simply, as you may be familiar with this, they take all reviews in all their forms and aggregate whether or not the review was positive or “fresh” (thumbs up, above 60% or 3 stars) and give a score that “represents the percentage of professional critic reviews that are positive for a given film”. As this system allows for reviews from all sorts of systems to be aggregated, Rotten Tomatoes is often one of the more trusted or go-to indicators of public opinion.

Getting the Data

To attempt to answer the questions above, I was going to need data - a lot of it…but also not all of it. To do this and help draw out some of the relevant overarching data, I made a few assumptions. Firstly, the focus was on ‘modern’ cinema, starting from 2000 to 2014. Movie rating systems evolved around this time and due to the growth of the internet, this is when the quantity of reviews available grew and aggregators such as Rotten Tomatoes seem to give a better indication of critical acclaim. Kind of like how it’s easier to trust a restaurant rated 4.2 with 1000 reviews than one rated 5 with 8 reviews.

Secondly, the driver for this was based on a long and winding thought process that started with Matthew McConaughey. So I based the timeframe on a pattern of performance pre and post his Academy Award in 2013 to now. As such, I want to look at patterns within the same time frame of +/- 6 years from an actor’s first academy award win.

The data was collected from two sources. I wrote a Python script to0 scrape Wikipedia to get a list for all Best Actor and Actress. With that, I used the data and to guide a further web scrape of each winner's filmography page on Rotten Tomatoes. I’m happy to share my code, just drop me a line!

Building a Spatial Interpolation Model for IoT sensors /  by Usamah Khan

Photo by oxana v on Unsplash

Photo by oxana v on Unsplash


Over the past few years I’ve been passionate about working with open IoT sensors and building models to enrich whatever data I find. Like with most things that happen to grab my interest, I spent a lot of time reading about spatial modelling and prediction. This has come in handy for some projects I’ve been a part of like inferring missing data to build virtual sensors to working with wearables to measure air quality through subjective experience.

As the caliber and scope of the projects have grown, I’ve been spending more time looking for solutions that are scalable and offer a degree of interactivity. This is when I stumbled upon ‘Kriging’.

Before all this, just a bit of background. I started looking into this problem during our second phase of WearAQ that you can learn more about over on the blog. To recap, we hosted workshops and pollution exploration walks with students in London and asked them to measure air quality through their own perceptions using low tech wearable devices. We contrasted this data with predictions generated from regression experiments we conducted on air quality data available close by. The idea being, could we use the near by data as a ‘ground truth’ approximation of the air quality at certain time.

However as we grew the experiment, we wanted to make some better comparisons, so we looked at how we could go about predicting air quality at any point, any time between sensors and not just a nearby approximation.

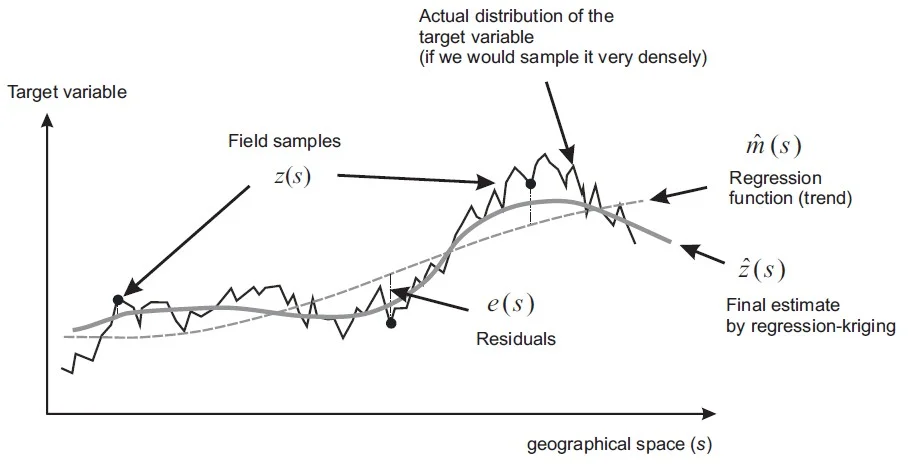
Now enter Kriging, a spatial prediction method that takes a regression function and, in conjunction with the residual (the difference between the estimated and predicted value) and iterates in an effort to minimize the error to give a better fit to the data. In 1-dimension this can be shown below.

 
By Tomislav Hengl - Own work, CC BY-SA 3.0, https://commons.wikimedia.org/w/index.php?curid=19985745

By Tomislav Hengl - Own work, CC BY-SA 3.0, https://commons.wikimedia.org/w/index.php?curid=19985745


If you’re interested in the math I recommend Engineering Design via Surrogate Modelling by Forrester, Sóbester and Keane and Capaulson's great library for Kriging in Python.

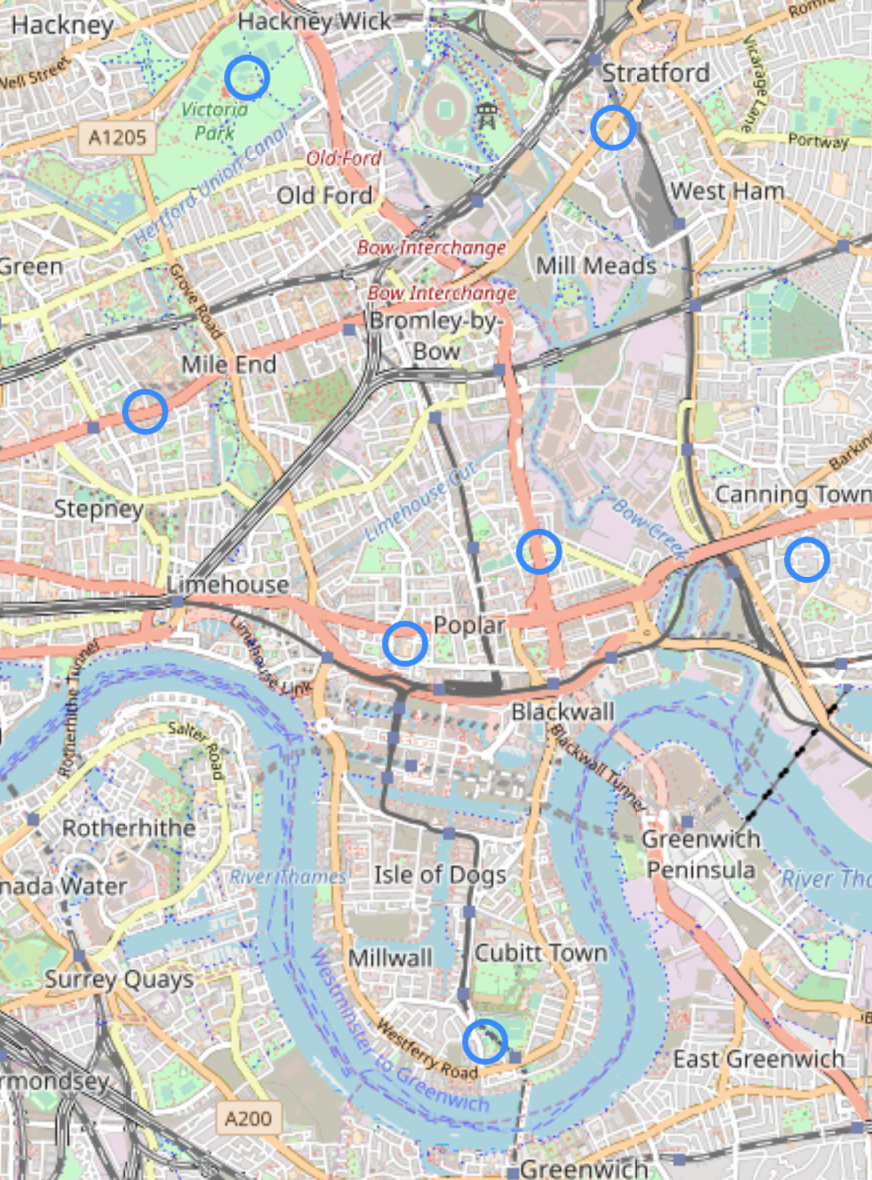
We wanted to apply this to a 2-D problem. In this case, we were interested in air quality in the borough of Tower Hamlets.

 
Map of Sensors.png

There are 7 sensors in Tower Hamlets that we were able to pull data from. We were lucky to be able to find data for 5 pollutants ranging back 10 years from London Air Quality Network. That helped us get a desired coverage over every hour of every day in a year and wherever there was missing data, we used an algorithm to impute.

But that’s for another blog post. Just know that by doing this, we now had the ability to query a value of one of five pollutants related to air quality at any hour of any hour, day and month of the year.


With the ability to query a prediction at any time we wanted, we could now move on to building out the model in Python. As we wanted to build an interactive and responsive web app, we chose to develop in Python as we could implement our model in Flask as a framework. To help with that, pyKriging is a great library I found that takes care of most of the complexities of the algorithms and has useful functions that make it easy to handle and train your data.


The documentation is pretty straightforward and there are a couple of examples on the repo to take a look at, but quite simply all you need to do is make two arrays - one for your location (lon, lat) and one for your pollution values. Simply pass those through the model and voila.

X /*Initialize an array for lon, lat*/
y /*Initialize a vector of output values*/

optimizer = 'pso'

k = kriging(X, y)
k.train(optimizer = optimizer)
k.plot()
 

Prediction is only one aspect of the model however and is the nature of all prediction, it’s not always 100% accurate. This is where Kriging comes in handy. To determine how confident we are, we also took a look at the Mean Squared Error (MSE). Simply put the the MSE is a measure of the quality of the estimator. It is a non-negative number where the closer the values are to zero, the better. Plotting this side by side to our prediction we can get a good idea of the quality of the model

 
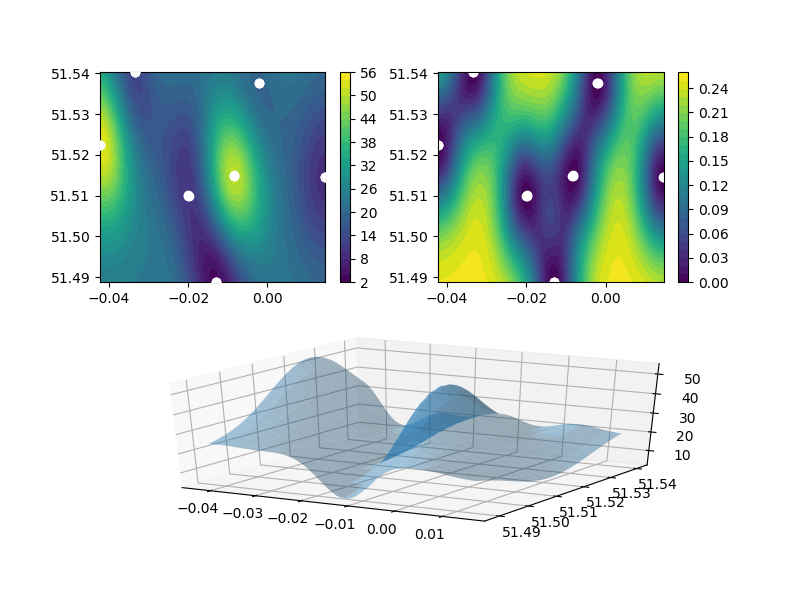
An example output over the experiment zone

An example output over the experiment zone


There are three parts to the chart. The graph on the top left shows the sensors with a heat map of the Air Quality - in this particular example, the NO levels displayed from 2-56 ug/m3. On the top right, it shows a similar graph, however, instead of the showing the value for AQ, it shows, at each point, the estimated error. As we can see, around the sensors, the error is 0 or close to. This makes sense since we can assume that close to the sensor, the AQ should be more or less similar. Lastly the bottom chart shows the NO levels, but modelled in 3 dimensions as a topographical map.

The yellow shaded areas on the graph show zones of high error where our confidence in our prediction is low. However, if we were to take some measurements in those areas, we might be able to improve the overall accuracy of the model.

This error is the model error. There may be a higher or lower error based on environmental factors in the area between the sensors. Like we mentioned, air quality can change from street to street, but by using this model we can at least provide a baseline for our analysis to a relative accuracy.

One last note to make is that if the data varies wildly between sensors or not enough, the model has a hard time making accurate predictions the further you get from each point. To deal with this after some experimentation, we settled on the idea of adding 2 to 3 ‘dummy’ locations a short distance away from our known points to force the data to converge at that point. Testing this on good datasets shows that it had a negligible impact on the prediction but made a big difference with data that the algorithm had difficulty in modelling.

This idea of looking at areas of low confidence was the basis of the idea behind building an engine that could recommend new locations to take measurements. Determining areas of high error, we would then be able to crowdsource a better understanding of air quality.

We wanted to use the participants to add a layer to our model and give their perception of the data certain points around the workshop area. To do this we use a process known as ‘infill’. Based on a choice of one of two criteria the infill model chooses where to take new measurements. The two criteria are “expected improvement’ to the model and ‘maximum mean squared error’ improvement. These are just two ways of looking at the area and asking whether to improve the whole model, or pick in areas with the highest error.

We use this method to pick locations for our participants to walk to. As we are trying to model Air Quality and have the workshop participants have a voice in their community the more measurements we have and the better the location of the measurement, the better the overall coverage would be.

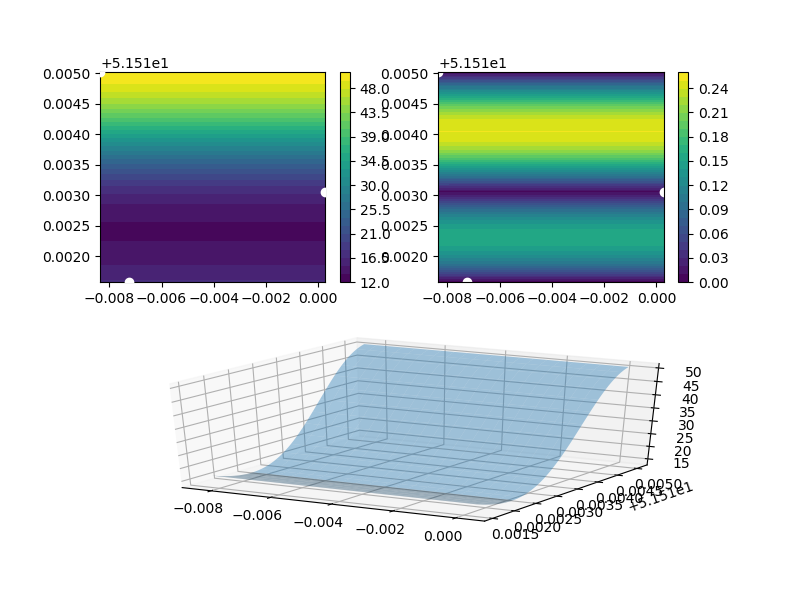
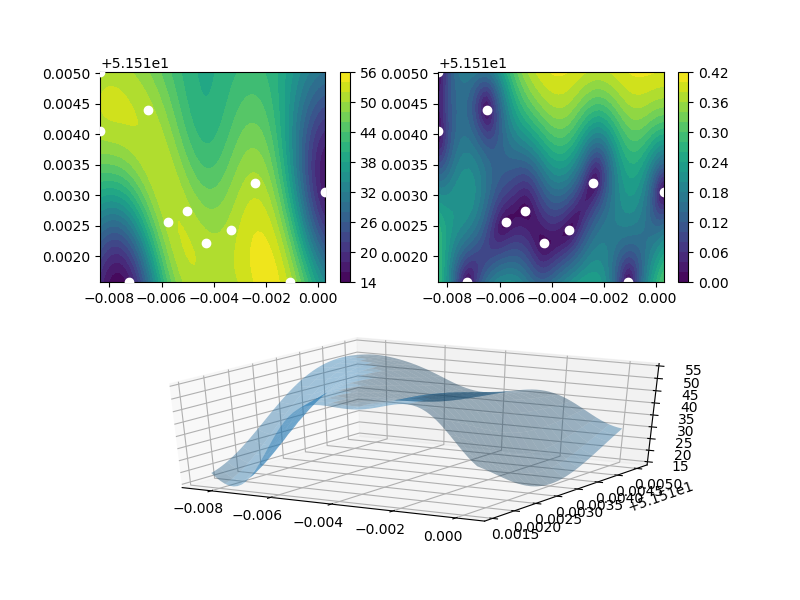
So to infill for a workshop, we can “zoom” into a location and see where best to take measurements. To zoom in, we query 3-4 locations around the workshop area, extract the prediction and push it through the kriging model again to estimate the spread of air quality in that zone. From there, we can ask the model to infill new locations for us.

 
Workshop_1_init.png
Workshop_1_loc.png
 

Above shows an example of zooming and infilling. The chart on the right shows the infill locations and how they would affect the model if the prediction there was to be taken as truth and modelled. The locations may not look like they are where the highest error is in the chart on the left, however this is due to the fact that the model works by iterating - adding a location, re running the model and then picking a new point. Through this whole process the error and prediction is tightened to give a more accurate representation of the area.

This is how we were able to build this second phase of the project using spatial interpolation to power an interactive platform for crowd-sourcing air quality. For any more information, feel free to reach out or check out our full write up on the Umbrellium blog!


Virtual sensors: using IoT and data science to fill in ‘missing’ data /  by Usamah Khan

Photo by Thomas Richter


“Thingful” indexes dozens of IoT data repositories and millions of sensors around the world. These range from environment, traffic, health to technology sensors. All these objects are connected and report geo-location and time-series data an output it to a map where you can explore your environment to gain insights into the world around you. But that’s only if we look at what the sensor want to tell us though. So what can the things in our environment tell us all together and what can we infer from them? This summer I worked with Thingful conducting data science and machine learning experiments to see how Thingful might 'fill in the gaps' of 'missing' data to create 'virtual sensors', by drawing on its vast index of multi-domain data. The folks at Thingful were kind enough to share my report on our findings over on their blog and I highly recommend anyone interested in IoT and data to take a look. They're an amazing group of makers.


Suppose we want to get a glimpse of temperature in real-time.  Take the area of a city, divide it up into a grid of small segments and find the temperature in each location. To do this we’d need thousand of sensors normalized and of a consistent accuracy. At this point in time, the resources just doesn’t exist. However, we have other data; a lot more “things” connected that surely relate to one another. With this is mind, can we estimate, with a reasonable degree of confidence, the temperature at every location through a combination of the following calculations:

  • Interpolation between the sensors we have

  • Correlation calculations for non-temperature sensors with similar sensor ranges that correlate with an X-Y range of temperature, e.g. air quality monitors, traffic sensors, wind, pressure, etc.

This was the purpose of a project that took place at Thingful during July. With a hypothesis we had to decide on goals for the experiment and ask what would we consider a satisfactory result?

  1. Prove that we can infer and impute information we don’t actually have in this framework

  2. Prove that a model can work by creating and testing it on our known data

We chose London for our analysis because this was an area with data most easily available to us. Since the data we’re trying to predict is time-series (temperature) it made sense to pull data from the same time. 

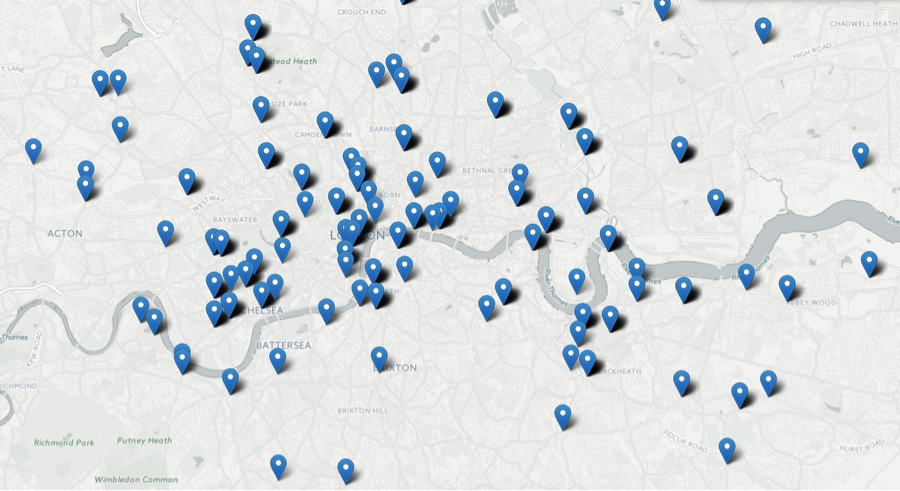
Since we were pulling a lot of data we needed first to see how it was spread around London. 


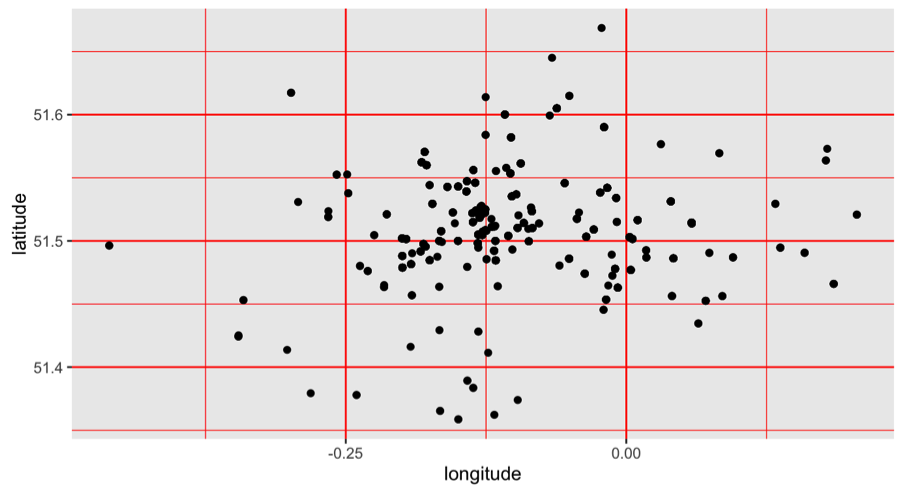
There was a huge spread and not entirely centered. To get a better idea of the longitudes and latitudes we were dealing with, we looked at the points on a Cartesian plane.


Inspecting it we found a large concentration of sensors in Central London and adjusted our limits.

We began by building a grid and defining the precision we wanted to achieve for our model. We had two options, either a larger resolution for a precise idea of temperature or a smaller resolution to get more of a spread of data.

After building a grid we associated all the sensors to each segment by using a clustering algorithm. This way, we had each sensor correctly associated with a segment and we could begin finding correlations.

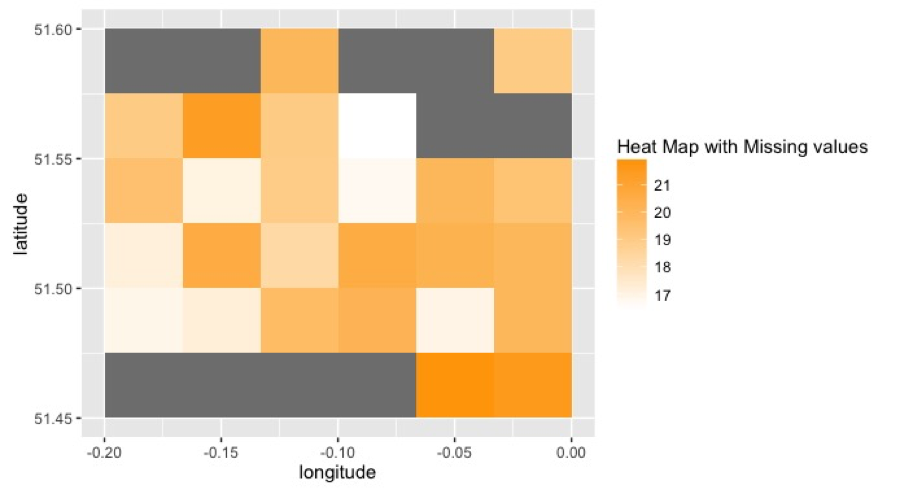
We then widened the data to understand the spread of variables. Plotting a heat map of temperature gave us an idea of where data was missing. As it turned out, at this resolution the spread wasn’t quite what we hoped for. But more so for reasons we discovered later.


The next step was to build a system to predict temperature. We found Machine Learning applying random forests worked well. Random forests are an extension of the decision tree algorithm. While decision trees classify by making branches until a classification is determined, random forests repeat the calculation with a random starting point over and over again to create a virtual “forest” ensuring a more accurate result. Though random forests typically predict best for classifications or discrete outputs we found that since our temperature did not vary greatly and was recorded in integers we had a range of 5 buckets from 16-21 C as our output. So random forests could be used effectively.

The result gave us an accuracy of 71% when we compared our prediction on the training set with the actual measured results. Not quite the result we were hoping for, but adequate for a first prototype. 

This essentially means that, using the model we developed for this experiment, we can use nearby air quality, traffic, wind, pressure and other environmental data that Thingful indexes, to predict with 71% accuracy what the temperature will be at a given location.

The biggest issue for us was a lack of data, both in quantity and in variability. We determined that pulling more data from a wider breadth of categories, for example including transportation and more environmental data, could help with the model. 

The final step in the process was to build a system where we could predict the temperature in areas where we don’t have that information. Since most of the data was pulled from the same sensors, we found areas with no temperature data were also areas where little other data exists. Where there is no data, there’s no correlation and hence no information to make a prediction on. So, at this point, we couldn’t finish this step. But this told us a lot about what we were trying to achieve and how we were going about it. 

This was just the starting phase; an experiment with the simple goal of “Can this be done?” - Something that couldn’t even be attempted without Thingful’s framework. After more experimentation, research and development Thingful might be used to build such a tool on a global scale. The question we’re all interested in is how will this change our context and interactions with our environment?


Using Talend and MySQL to Manage Data /  by Usamah Khan

Photo by Luis Llerena

Photo by Luis Llerena


In early 2015 I got the chance to work with UNITAID at the World Health Organization in Geneva. I was happy at the time to get the opportunity to work with some amazing people and do some challenging work. When I came in I had a pretty strong background in data processing and analysis. Yet as my internship progressed, my role became more about designing and building databases.

This was new for me at the time so I spent a lot of time researching and learning about different tools that I could use. In that time I discovered Talend, a simple to use open-source ETL tool that I can’t recommend enough. I learnt and collected so much information that I still use on my own projects, I figured I’d put something together that could be useful for others too. 

So, without further ado, I've separated the different sections so depending on if you're starting a project or need some tips half way, it should make it easier to follow.

Note. For this How-To I'm running through how to use Talend Open Studio for Data Integration 5.6 for Windows. I use Talend on Mac OS now and the functionality remains largely the same, bar the regular differences between Windows and Mac that users of both would know - Directory changing and "Right-Click" known as "Secondary-Click". This How-to should, hopefully, still help but if you have a comment or question get in touch and we can figure it out together!


Creating, Exporting and Importing Projects with Talend

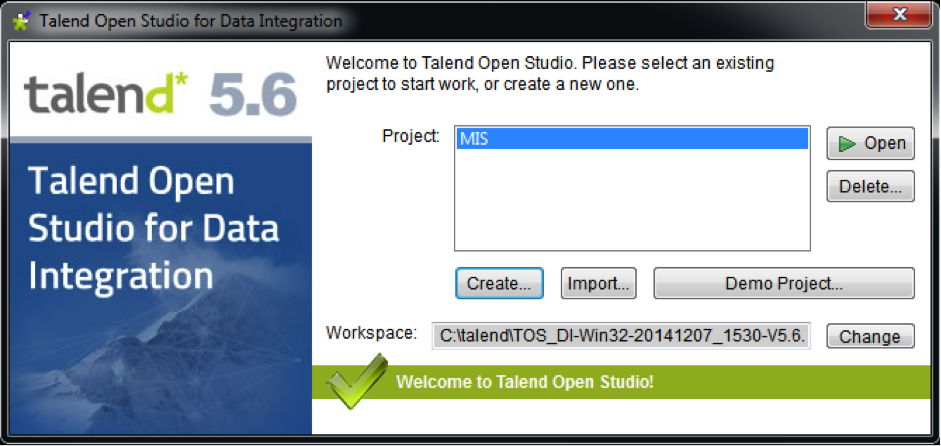
Importing and Exporting a project is a very simple affair in Talend. When you start up the program, the first window that comes up is where you manage all your projects

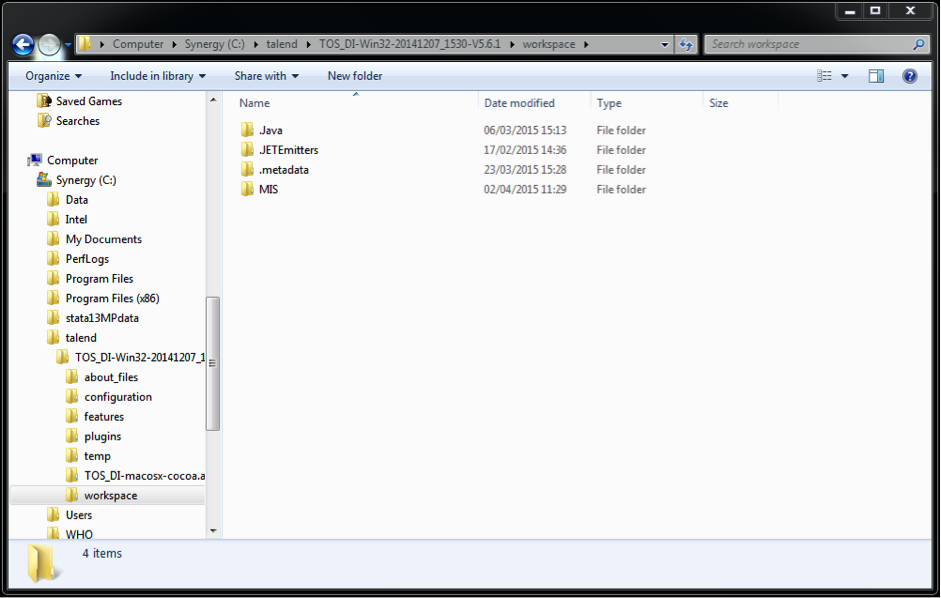
Fig. 1

Fig. 1

Creating a project is straightforward.

  1. Open Talend

  2. Click "Create..."

  3. Give your project a name and description

Sometimes however, you may need to import and export a project. This may be to/from a backup or someone else computer. Its not as simple and intuitive at first, but very straight forward when one understands the file paths and workspace directories.

So it's simple, yet follow the steps with care and make sure not to skip any

To Export a project:

  1. Find your root directory for your workspace in Talend. This address should be where it says "Workspace:" in the Fig. 1

  2. Open it up in your explorer

  3. Copy the folder and paste it to your desired location (a flash drive, dropbox, backup file path etc.)

  4. As long as you copy the whole folder, all jobs, connections and metadata will go where you put them

Fig. 2

Fig. 2

To Import a project:

  1. Open Talend

  2. In the opening window, from Fig. 1, click "Import..."

  3. In the Import window where it says "Select root directory", browse and locate the folder you saved

  4. Give the project a name

  5. Click "Finish"

  6. The file along with all jobs should now be imported to Talend


Using Talend

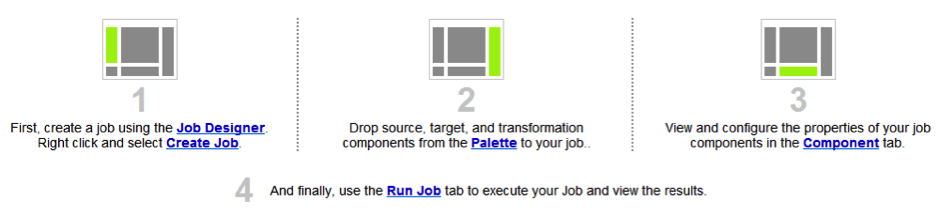
Talend Open Studio's interface is built around 4 tabs. The "Job Designer", "Pallete", "Component" and "Job" tabs. The location of the tabs in your window are shown in Fig. 3. The "Job" tab with the GUI is the one in the middle.

Fig. 3

Fig. 3


Extracting Data

Loading datasets and Defining Metadata

All relations and components for transformations are found, created and used in what are called "Jobs". To create a Job, use the sidebar to the left of the screen. Right-Click "Job Designs" and click "Create Job".

Talend functions to transform and load data. Therefore, one of the most important steps in any process is to properly define the metadata and connections to existing databases. It's important to be thorough during this process because any errors that will occur won't be due to coding or bad relations but incorrect definitions of columns, pathways and files. Talend is strict with its rules and so take care in all the steps you take here.

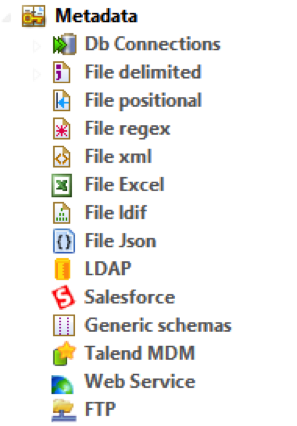
There is a whole section in the "Job Designer" here that allows you to define and load all your data. You can upload from delimited, Excel, JSON files and even establish connections to databases and pull from there.

  • Loading Datasets - Delimited files

Fig. 4

Fig. 4

  1. To create a connection to a delimited file, right-click on "File delimited" and select "Create File delimited"

  2. In the window that appears give it a name and click "Next"

  3. In the next window, choose a file path by clicking "Browse"

  4. There is a handy file view underneath that shows the delimited file

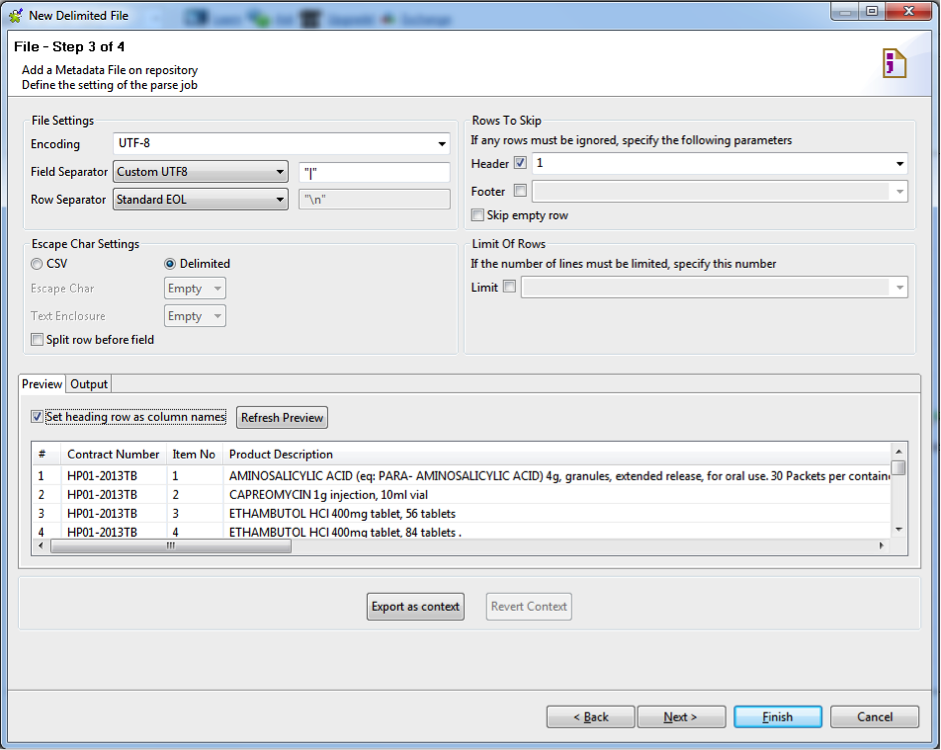
  5. Press "Next", this window is where you define the delimiter and headers of your file, much like Excel's .csv Import Wizard

  6. Make sure that the "Field Separator", "Encoding" language and "Header" are all correct.

Tip. You can always check "Preview" and refresh to see the first 50 lines of data

7.   Fig. 5 shows a correctly formatted window to load from a .csv file 

Fig. 5

Fig. 5

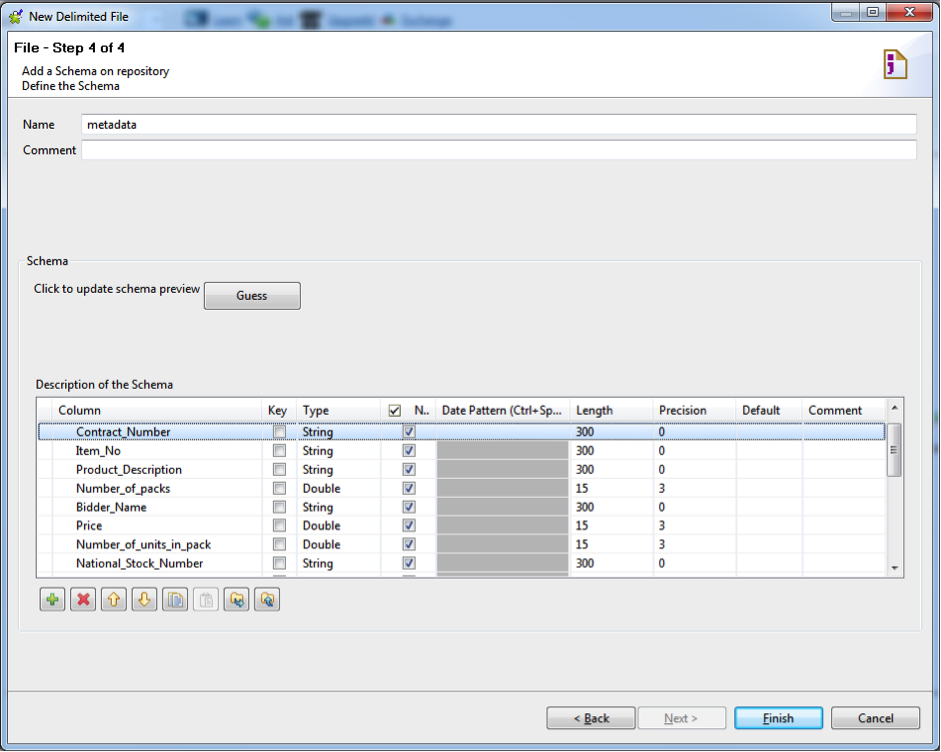
Now that you've loaded the dataset, you need to define the column types and lengths. Here is where Talend is very strict and unforgiving when it comes to data transformations down the pipeline. You will get errors if you don't define your metadata correctly. For this reason its suggested that you spend some time defining a strategy for how you want your final data to end up.

Example: You have two columns, lets say "Number of Units per Pack" and "Unit Price", defined as Integer and decimal respectively. Lets say you want "Price per Pack" so (Unit Price)*(Number of Units per Pack). It won't calculate because the values are different types so Talend will not be able to define a new column type. Additionally, if you have string values and you don't define the length properly a data truncation error will occur and your data will not load.

Hence, my suggestion for most datasets, give all columns of the type "String" a length of 255 and for all columns with numbers, set them to "Double" with length 15 and precision 3. If errors still occur, adjust the length of the problematic column. Fig. 6 shows a correctly set up description of the Schema.

Fig. 6

Fig. 6

Note. This are workarounds based on my experience, if there is something I'm missing or doing incorrectly please let me know!

  • LOADING DATASETS - EXCEL FILES

The exact same steps can be taken for Excel files, just choose "File Excel"

  • LOADING DATASETS - JSON FILES

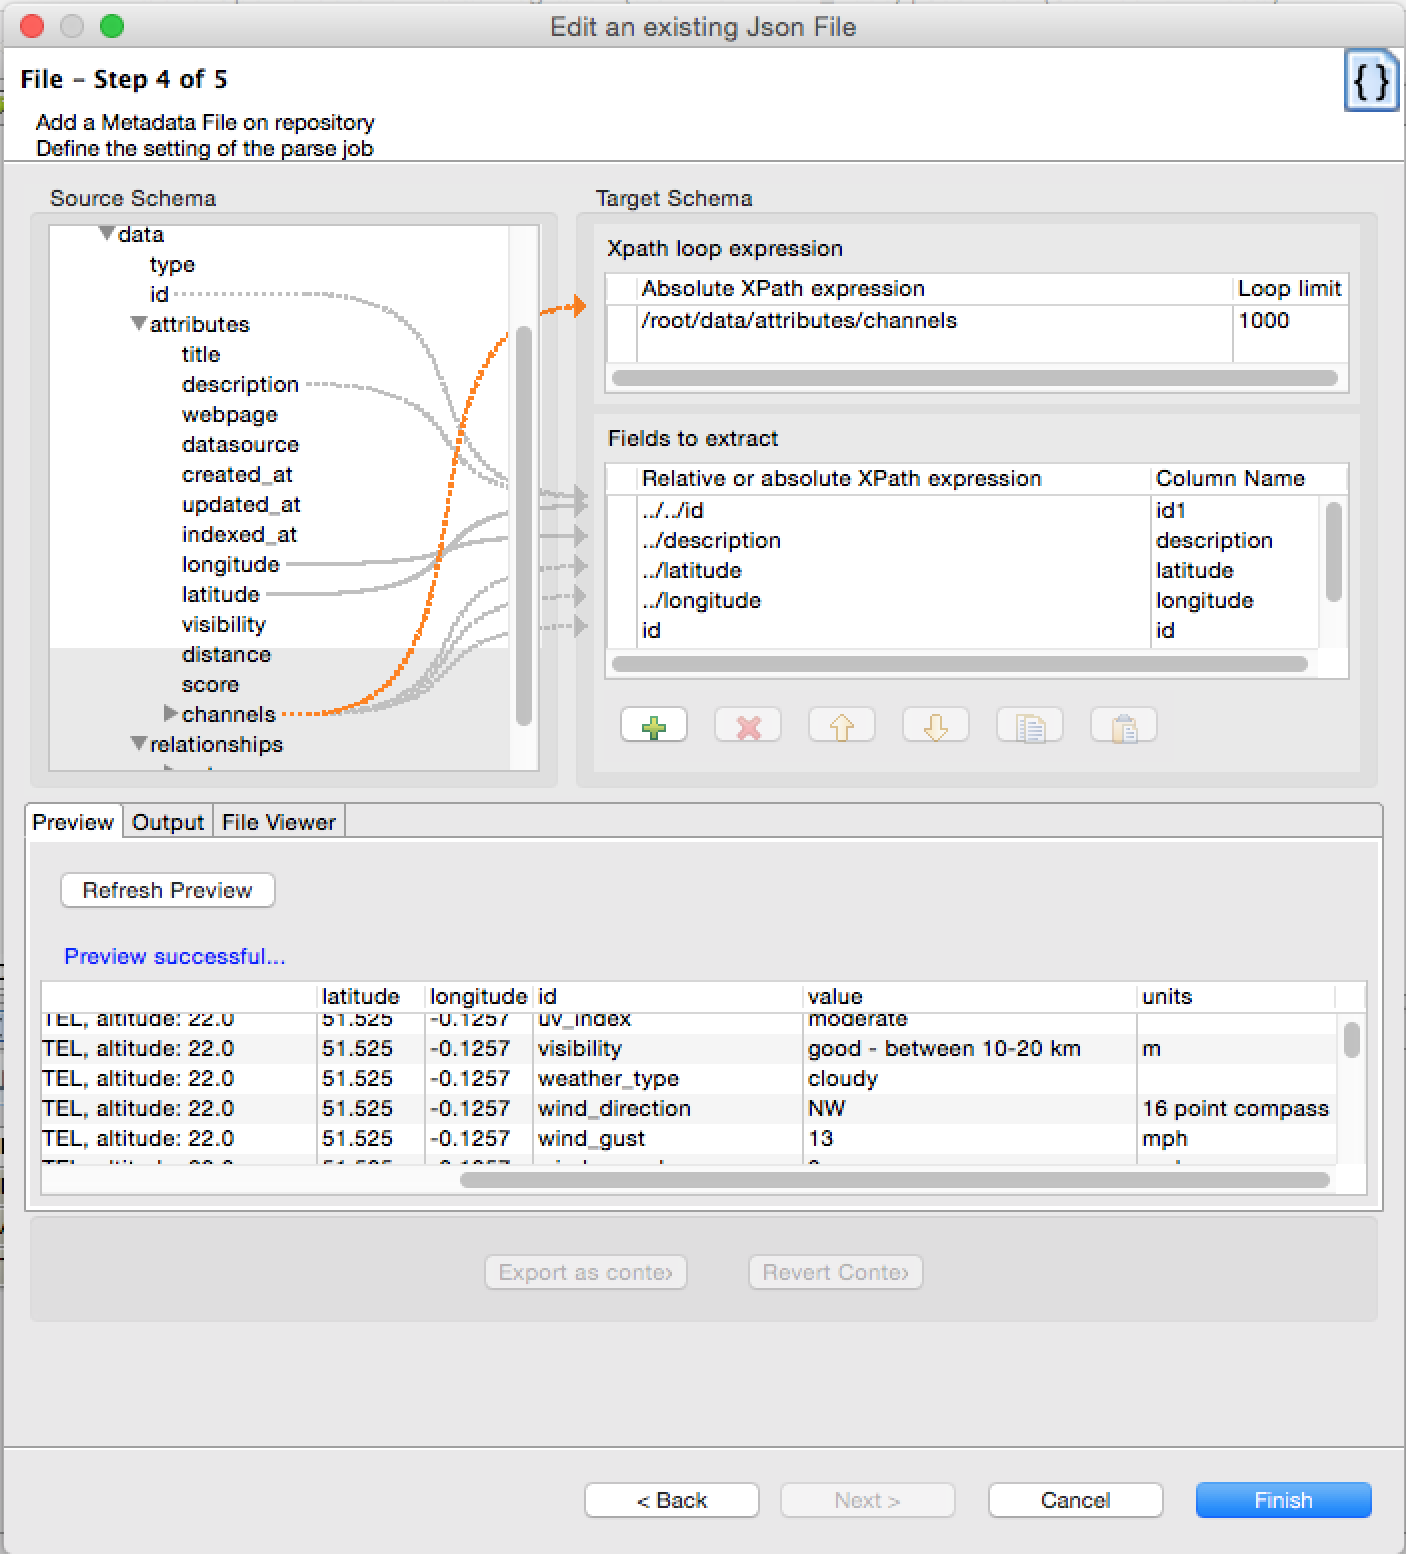
Talend is extremely handy when dealing with JSON format files. Especially when dealing with arrays of different types. It's what I hated most about dealing with JSON. But Talend has this handy way of dealing with it.

To get to it, select "File JSON" from the "Metadata" folder and fill out the first few steps just like I explained above with the delimited files.

In the figure below I've tried to add a Metadata File to parse the data. An array exists that I want separate rows for each unique ID. I simply select that as my "Xpath loop expression" and pick the fields to extract. At each stage of the process I can always "Refresh Preview" my data and see if I'm getting what I want. 


  • Loading Datasets - Database Connections

Connecting and calling to databases is a great function of Talend. It allows you to pull data from MySQL, Oracle, Access or most other systems and even write to them eliminating the need to do cumbersome transformations in SQL. To set this up you first need to create a connection.

  1. Go to the sidebar and right-click on "Db connections" and select "Create connection"

  2. Give the connection a name

  3. In the next window choose a Database type (MySQL, Oracle etc.)

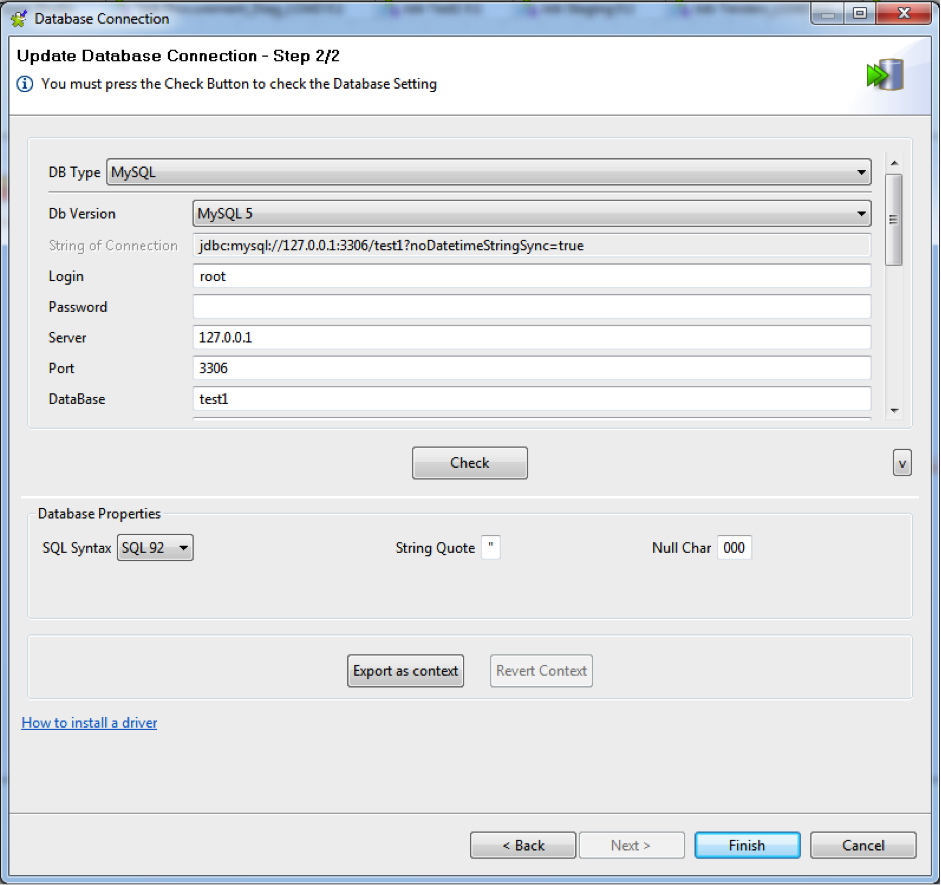
  4. Fill out the relevant information for Login, Server, Port and Database

  5. Fig. 7 shows correctly completed fields.

  6. Once you've established a connection you can retrieve Schema. Simply right-click the connection you just created and select "Retrieve Schema"

  7. Select your filters if needed (recommended just leave as default)

Tip. You can check the connection to make sure you inputted the details correctly. Just click "Check"

Fig. 7

Fig. 7

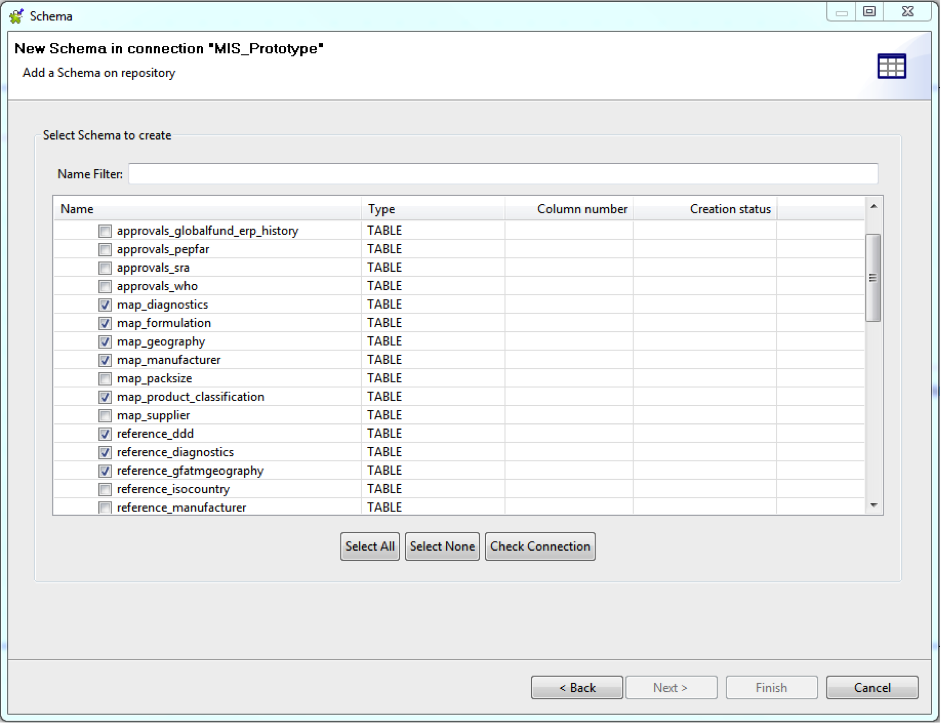
8. Select the tables you want to import as shown below in Fig. 8

Fig. 8

Fig. 8

Fig 9.

Fig 9.

Once again, you need to make sure to check the tables and the defined column types and lengths

  1. Expand the "Table schemas" folder

  2. Right click on any table and select "Edit schema"

  3. Follow the same editing rules as with delimited and Excel files

  4. Your tables are ready for use!

There may be cases when a project has been imported into Talend from another computer or area and the filepaths and directories are different to databases. In that case it's necessary to edit the connection. To do so follow the steps.

  1. Go to the sidebar and click the "Metadata" tab

  2. Expand "Db Connections"

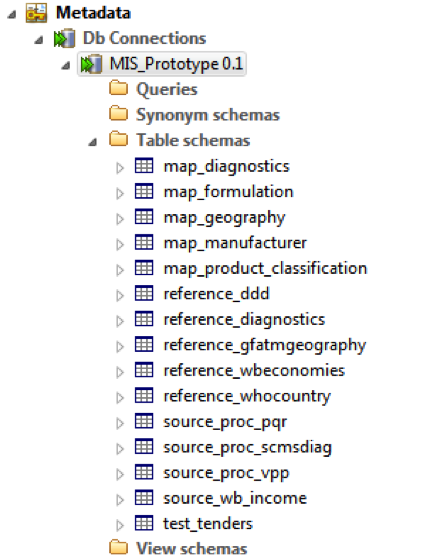
  3. Right-click your database, in this example "MIS_Prototype"

  4. Click "Edit connection"

  5. Click next and in the following screen change the relevant information to connect to your database.

  6. Click "Finish"


Data transformations

Components in talend

Loading and defining metadata for datasets is the trickiest part of your workflow in Talend. After that, its Once that's done properly it becomes very easy to get the hang of the different components to make relations and transformations. Below I've put together a list of useful components that can help speed up any data handling process. 

So now that you you've got your files, to make a transformation simply drag the desired file from the "Job Designer" into the job space and choose how you want it in your workflow i.e Input or Output.

Lets take a look at some components useful for data processing 

Fig. 10

Fig. 10

tMap - Processing > Fields (Deprecated)

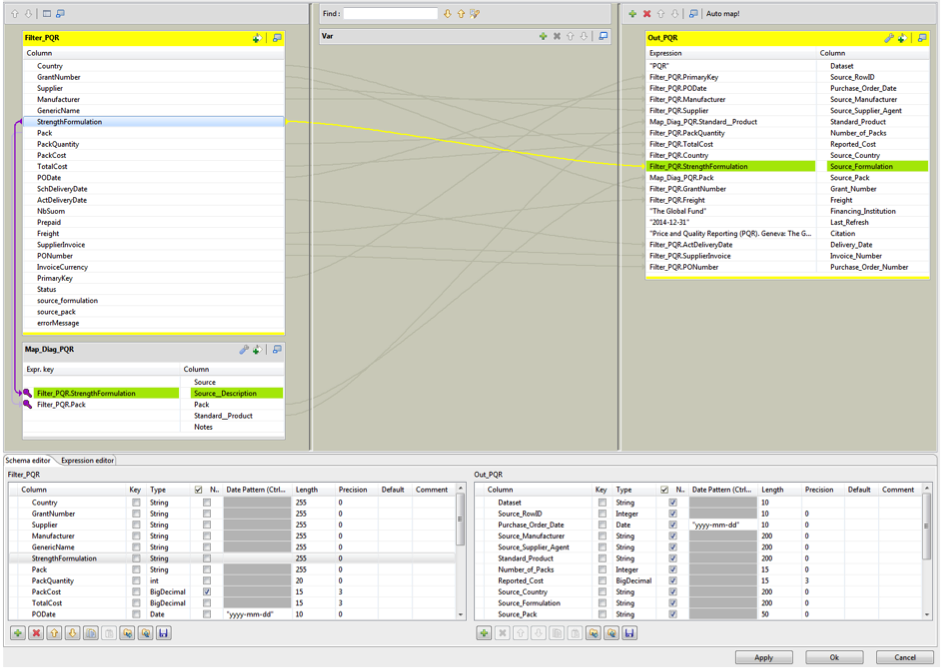
The tMap function is probably the most handy component. It allows you to map data from various lookup tables, perform transformations to a new output and drop and reorder data as desired. The process involves very simple steps of dragging and dropping using the UI. Fig. 11 shows an example of a connection with a map and transformations.

It's also possible to code a specific equation or create and handle string data using the expression space. You can create new outputs and columns using the green addition buttons. Remember once again that the you have to define the size and output of the new variable. Also note, Talend uses the Java convention when defining strings whereby " " must be placed around everything.

Fig 11 shows the highlighted item "Strength Formulation" mapped to the lookup table via a purple connector and to the output via the yellow

Tip. Always make sure that you have an output coming from a lookup table. If you have a mapped table and no specified output you will get an error since the component is trying it's best to lookup and retrieve a value.

Fig. 11

Fig. 11

Fig. 12

Fig. 12

tFilterRow - Processing > Fields (Deprecated)

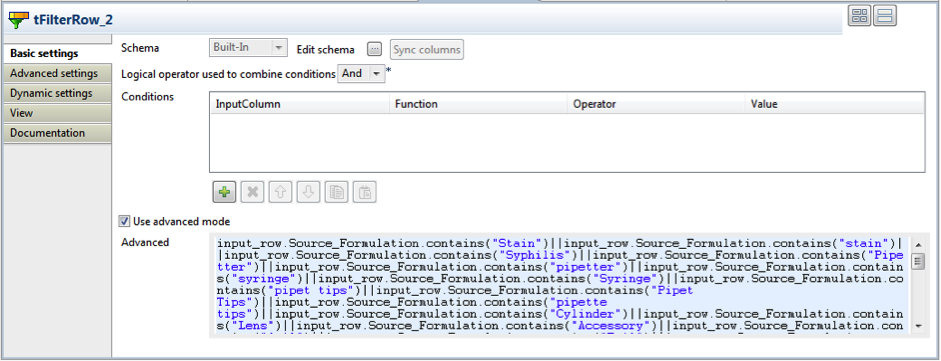
The tFilterRow component allows you to filter values out, for example wild cards in your data. To filter go down to the "Component" tab and use the "Advanced" box to input an expression for filtering. Fig. 13 shows a filter for rows that contain the strings defined. As you can see it's the same as how MySQL filters data. When you've finished filtering, right-click on the component in the job space and go to Row > and select the desired filter: Reject or Filter.

Fig. 13

Fig. 13

Fig. 14

Fig. 14

tUnite - Orchestration

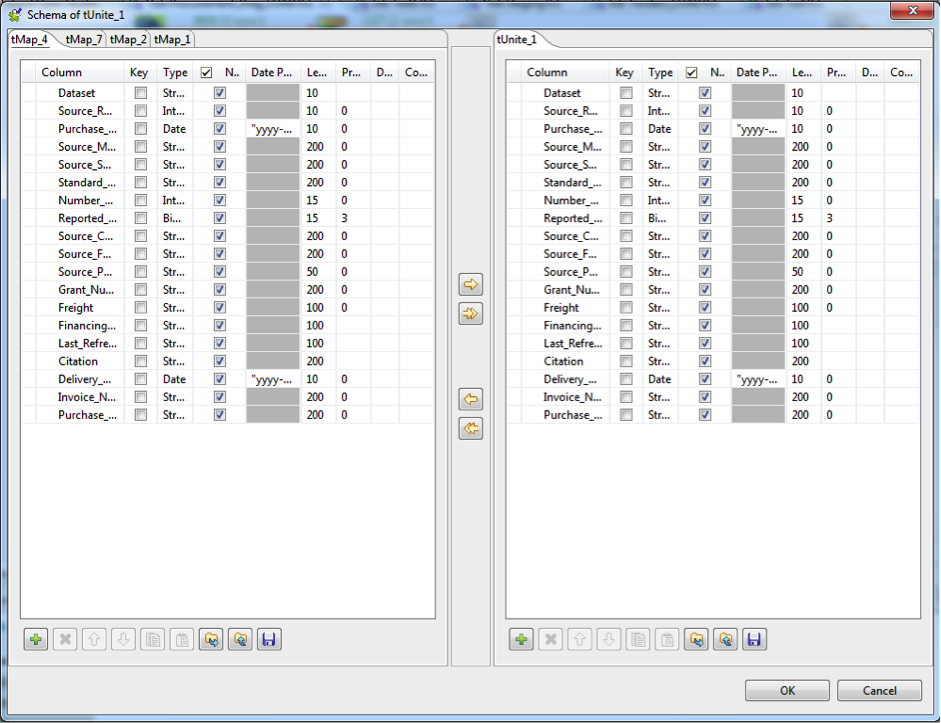
tUnite is used to merge multiple data tables. Like with everything in Talend, you have to be careful that all the metadata lines up exactly. i.e. all the files coming in are of the same number of columns, length and type. Double click on the component and click "Sync Columns". Next to it is a button labeled "..." adjacent to the text "Edit Schema". Click on this to se the files and if they are the same like shown in Fig. 15. In this window its possible to check every column against one another and make sure they are the same.

Fig. 15

Fig. 15

Fig. 16

Fig. 16


tLogRow - Logs & Errors

tLogRow is a helpful tool to check on how your code is running and if the values are going through. Place this at the end of your pipeline and it will catch and display in text in the "Component" tab.


Fig. 17

Fig. 17


tUniqRow - Data Quality

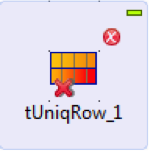
This useful component is great for de-duplicating your data, either by removing duplicates or outputting only duplicates. In the "Component" tab you can choose the column, key attribute and, if string, whether or not to make it case sensitive.


Loading Data

Fig. 18

Fig. 18

Fig. 19

Fig. 19

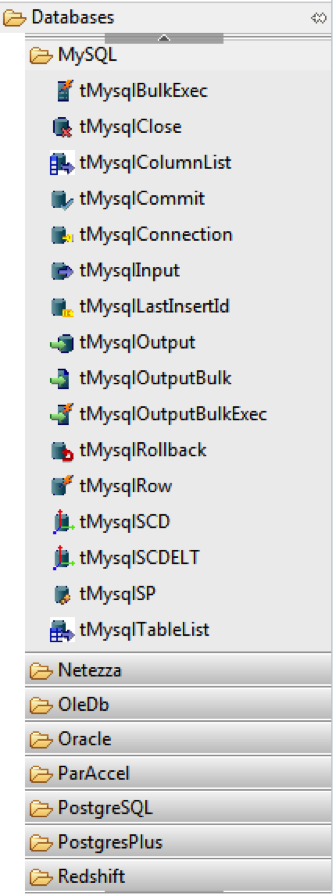
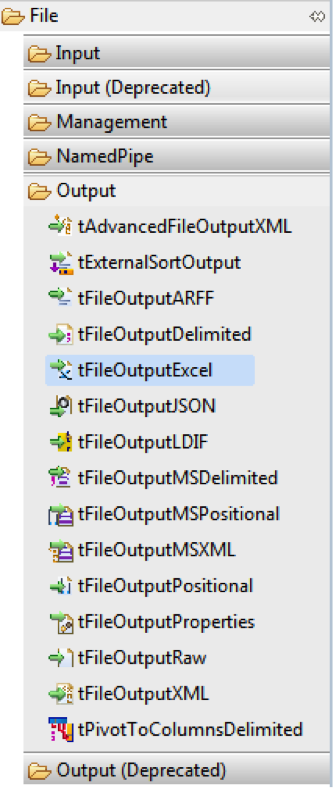
Now that you have a pipeline, the whole point is to be able to load the data somewhere. To output to files, or databases, you can do so by exploring the "Databases" and "Output" folders in the "Palette". There are a bunch of options for database connections and all common output formats. For example Fig. 18 and 19 show where to find outputs to MySQL and Excel.

Alternatively, if you already have connections to databases or files from an earlier part of your workflow you can drag and drop them from the "Job Designer" and choose the option for Output for your file.

It's important to get in the habit of syncing columns whenever you make a connection and making sure the output and input are the same by checking the schema.

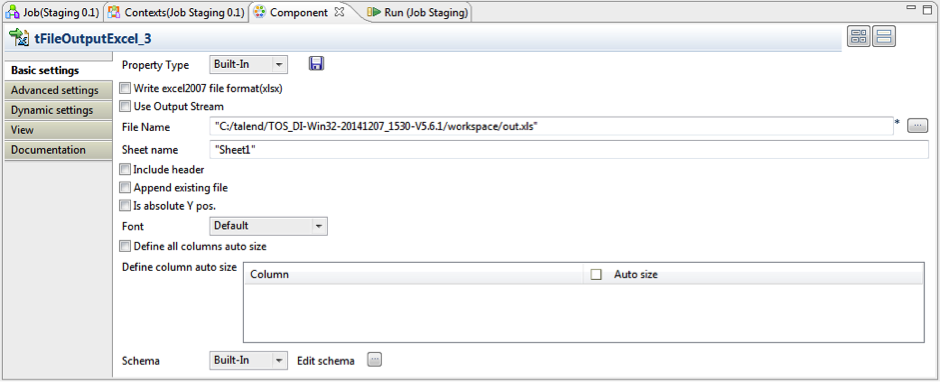
Tip. When outputting to Excel it's possible to append an existing file, either at the bottom, as a new sheet, or append the bottom of a specific sheet. Fig. 20 shows the default settings in Talend. Be aware to select "Include header" if you're creating a file from scratch.

Fig. 20

Fig. 20


Running Your code

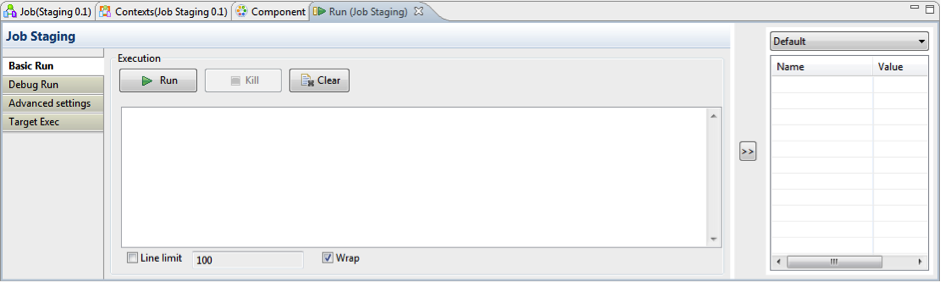
Once you've established all your connections and made your transformations the last step is to run the code. There are 2 options to run a code in Talend.

  1. A "Basic Run" will compile everything and output to your desired files and databases. This is used to actually retrieve and output. However, if there are errors, they are hard to catch and know where they are occurring if you run the whole code. So..

  2. A "Debug Run" will run and give you a row-by-row output of what is happening. This way you can slowly track the transformations. This is super useful when you're running a map with an expression and you want to check if its correct.

Fig. 21

Fig. 21

Fig. 22

Fig. 22

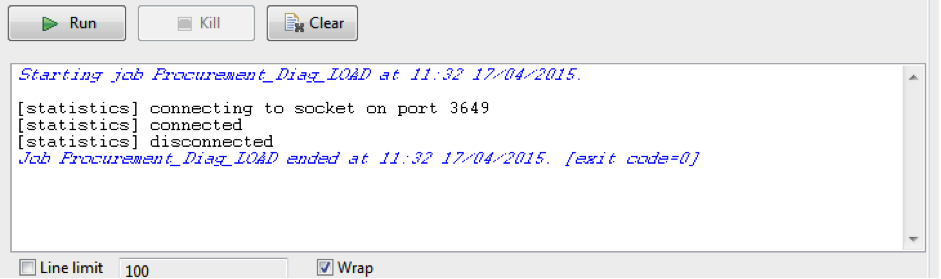
Fig. 22 shows the ideal output. No errors, connection and disconnect. When you get this, you know all is well with the process.


Thoughts and recommendations on talend

So that was a (relatively) quick run through of what you can do with Talend. I love this software. It makes a lot of my workflow quick and simple and I can see what I'm doing and how my pipeline is shaping up. I typically use MySQL to host my data, and every now and again I find it simpler to do a quick one-line of code transformation in there. But using Talend gives me the opportunity to share my whole workflow.

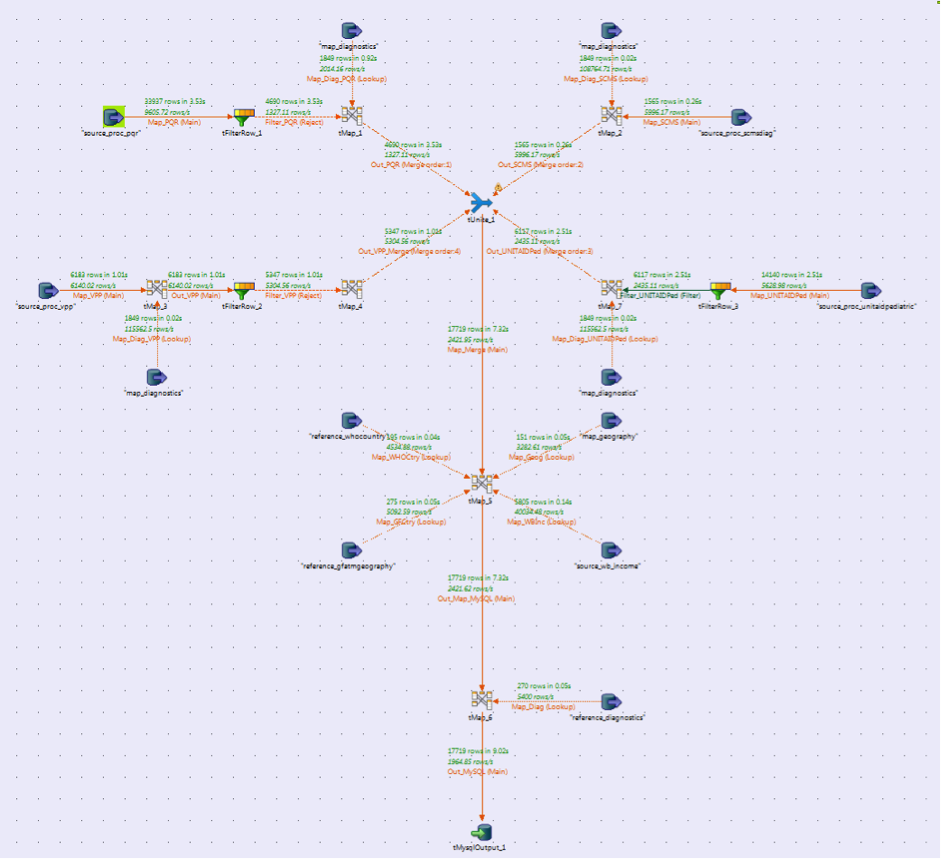
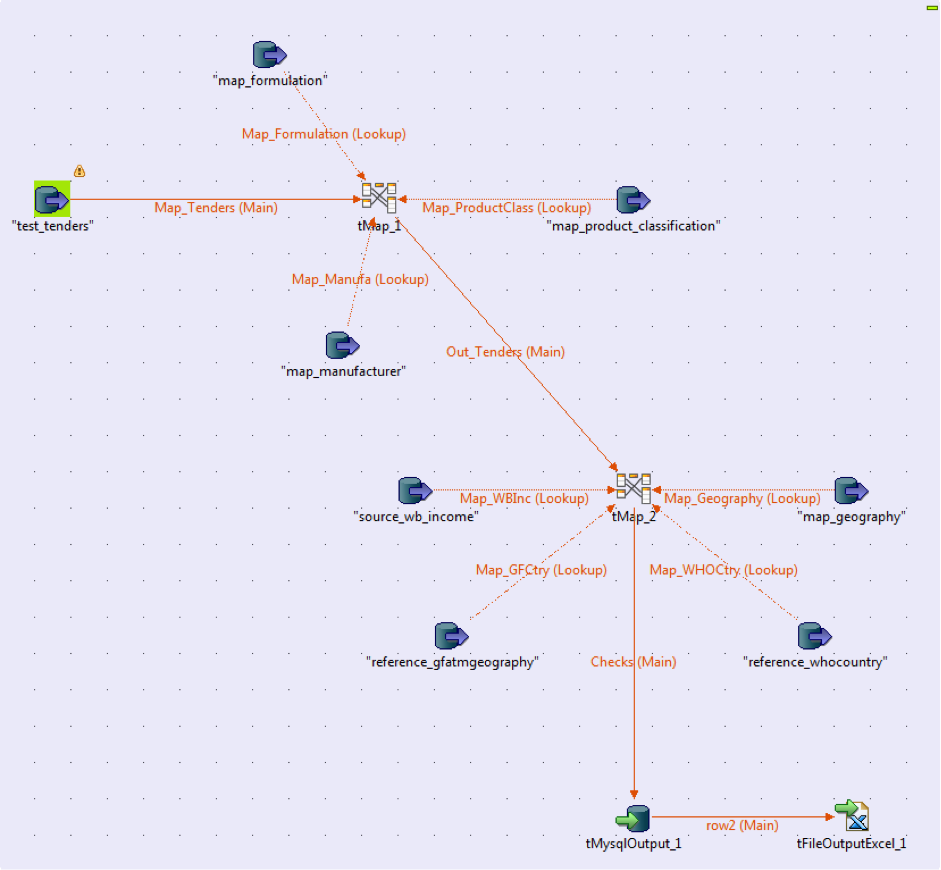
Another aspect of Talend is the beautiful User-Interface. A good project looking nice makes it look incredibly professional when sharing and becomes very intuitive when trying to explain a workflow to a project teammate. Fig. 23 and 24 show some examples of how you can arrange your work.

Fig. 23

Fig. 23

Fig. 24

Fig. 24

They have an excellent forum with support users who are super quick in getting back to a post (40 mins once at 7:00pm EST - AMAZING) and if you want to find out a little bit more about a component or process they have a detailed and jam packed with information Help Centre. I used a lot of these sources to figure things out but I never found a quick "How-To" for newcomers just starting out and needing a project.

So that's that! I hope you find this helpful. There's so much more to learn and even after a year of use I've barely scratched the surface of this great tool so as I keep saying, get in touch! Let's figure out how to make more.

How well are we working out? /  by Usamah Khan

The Human Activity Recognition Project (HAR) put together a study placing accelerometers on 6 participants. They were asked to lift the weights correctly and incorrectly and the goal was to examine how well an exercise was being performed. This project creates and contrasts Machine Learning techniques in R to determine the answers.

Read More